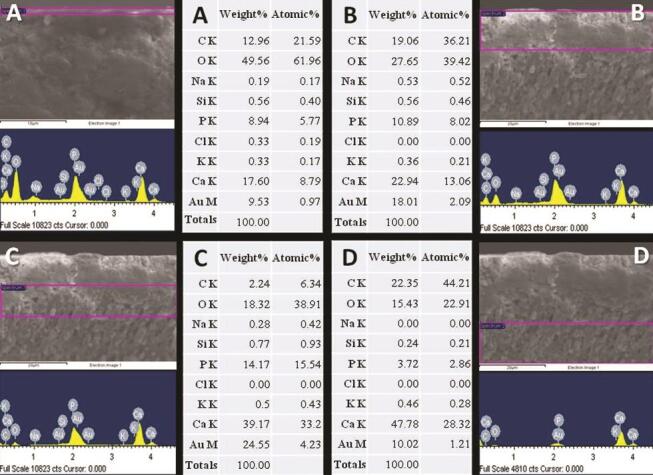
Fig. 2.

Representative scanning electron micrographs of the enamel cross-sections and the elemental mapping at different depths (from surface area A to the deepest area D). EDS detected stronger silicon signals at the surface area (0.56 weight%), which increased right below the mineralized layer formed at the enamel surface (C, 0.77 weight%), and decreased in the deepest area (D, 0.24 weight%). The amounts of sodium, phosphorus, and calcium also varied as a function of the depth.
