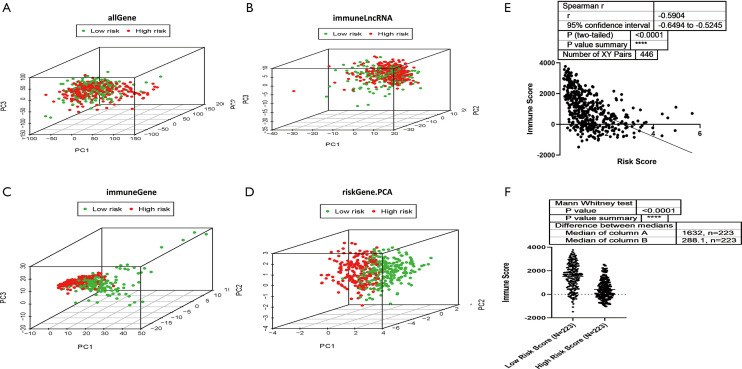
Figure 4.
The low-risk and high-risk groups showed different immune statuses. (A) Principal component analysis was performed between the high-risk and low-risk populations based on the entire gene expression profiles. (B) Principal component analysis between the high-risk and low-risk populations based on the 331 immune-related lncRNAs. (C) Principal component analysis between the high-risk and low-risk populations based on immune-related genes. (D) Principal component analysis between the high-risk and low-risk groups based on the 7 immune-related lncRNA signature. (E) Spearman R correlation analysis was performed for risk score and immune score in the SKCM microenvironment. P<0.0001 (Calculate method: Spearman r). (F) TCGA-SKCM patients were classified into high-risk and low-risk groups based on the 7 immune-related lncRNA signature risk score, and the immune scores of the tumor microenvironment in the 2 groups were compared. P<0.0001 (Calculate method: Mann Whitney Test).

