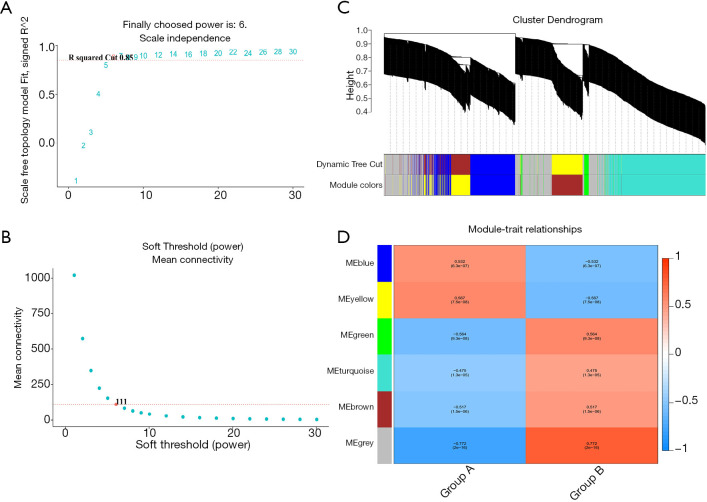
Figure 3.
Weighted co-expression network and gene module analysis. (A and B) Soft threshold selection process; (C) clustering dendrogram: each color represents a specific co-expression module. In the colored rows below the tree diagram, the two colored rows represent the original module and the merged module respectively. (D) Heat map of the correlation between vascular dementia (VaD) and the characteristic genes of the module.

