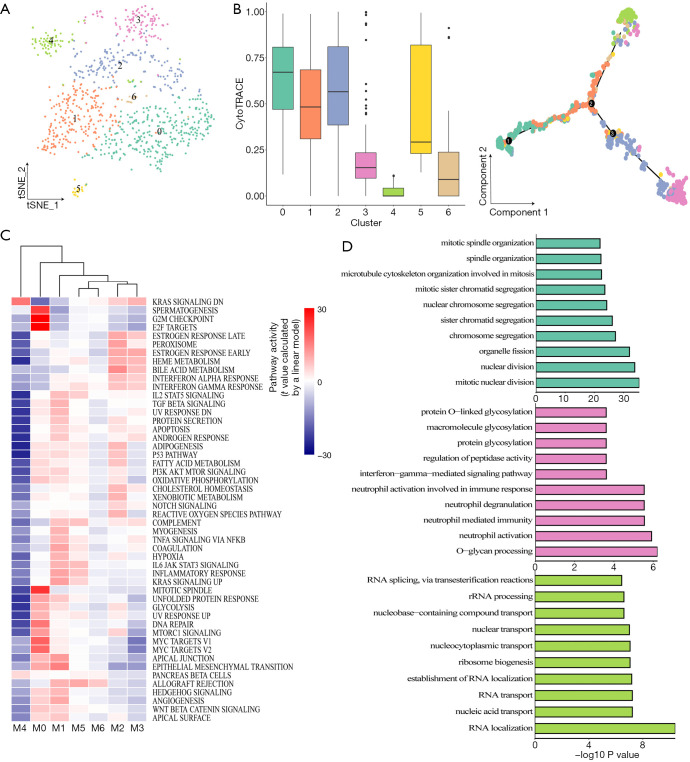
Figure 2.
Transcriptomic heterogeneity of malignant cells in metastatic liver tissue. (A) tSNE map showing 7 cancer cell clusters. (B) Boxplot showing transcriptional diversity of cancer cells estimated by CytoTRACE (left) and differentiation trajectory of cancer cells in GBC liver metastasis (right). (C) Differences in the activity of 50 hallmark pathways scored by GSVA software. t values were calculated by a linear model. (D) GO analysis of DEGs for cluster 0 (top), cluster 3 (middle), and cluster 4 (bottom). FDR <0.05 was considered as significantly enriched. GBC, gallbladder cancer.

