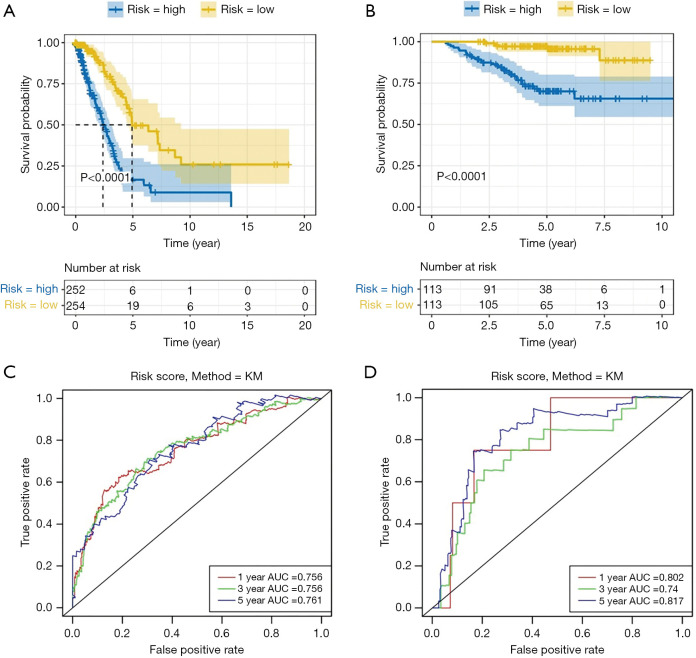
Figure 3.
Prognostic values of lung cancer-related genes. (A) Survival analysis of high- and low-risk groups in The Cancer Genome Atlas (TCGA) data set; (B) survival analysis of high- and low-risk groups in the Gene Expression Omnibus (GEO) data set. (C,D) ROC curves for the TCGA and GEO data sets to analyze the predictive value of risk scores for lung cancer prognosis.

