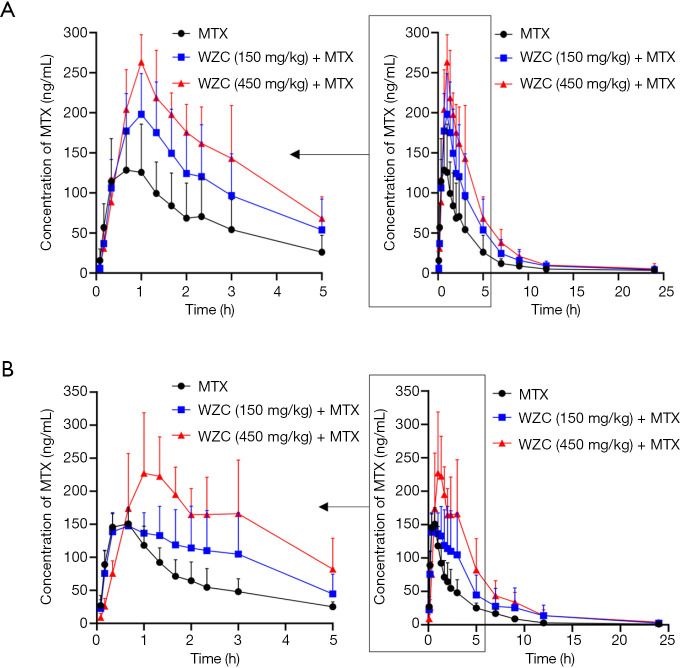
Figure 1.
Mean plasma concentration-time curves of MTX in rats (6 rats in each group) after the oral administration of 2 mg/kg MTX with or without co-administration of (A) single-dose WZC and (B) multiple-dose WZC. Each point with a bar represents the mean ± SD of 6 rats. MTX, methotrexate; WZC, Wuzhi capsule.

