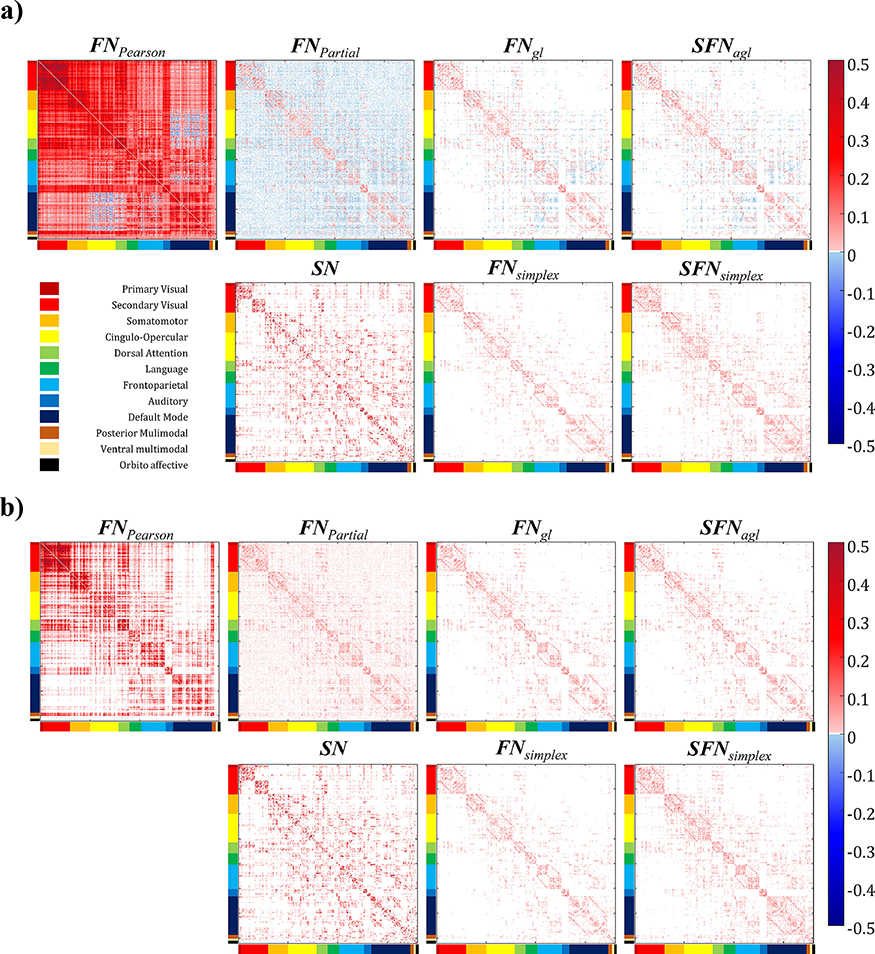
Figure 1. Visualizing the average network pattern across subjects.
Sub-figures (a) and (b) visualized the average network pattern before thresholding and after thresholding, respectively. The brain regions were ordered according to the Cole-Anticevic Brain-side Network (Ji et al., 2019).

