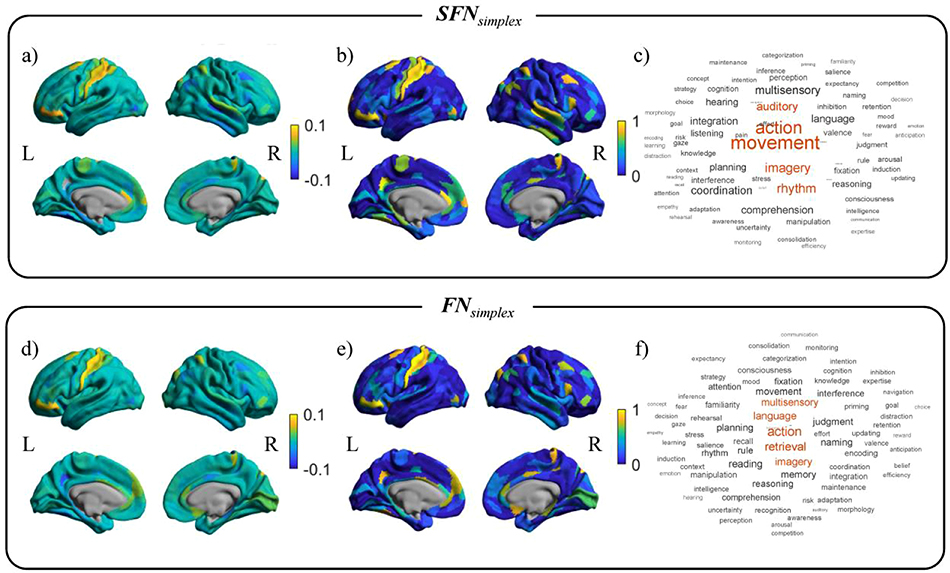
Figure 5. The activation pattern maps and the related cognitive topics for predicting the gF score.
Top row: the mean standardized regression coefficients from the prediction model and their decoding results using SFNsimplex. Bottom row: the mean standardized regression coefficients from the prediction model and their decoding results using FNsimplex. For each sub-figure, left column: mean standardized regression coefficients map. Center column: selection probability map. Right column: word clouds plot related to cognitive function in the Neurosynth database.

