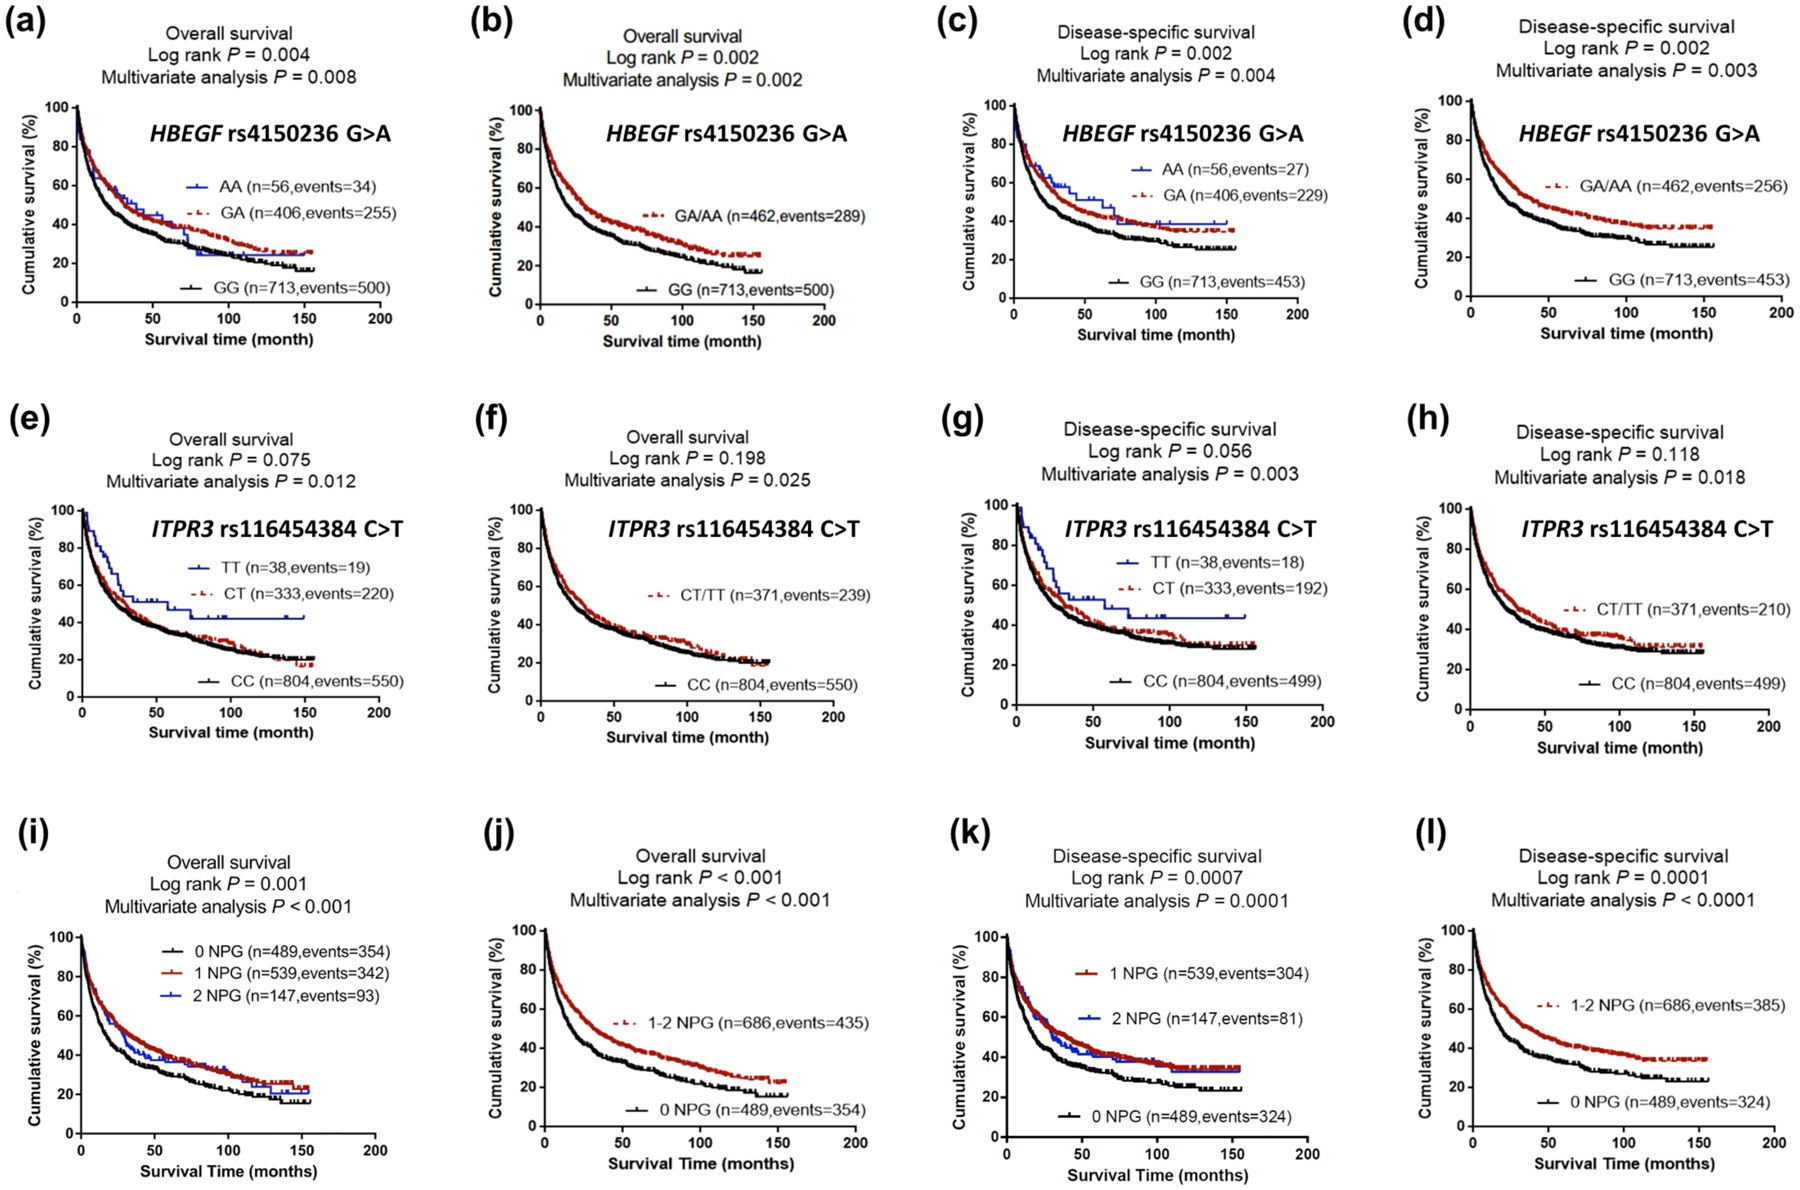
Figure 2.

Prediction of survival with genotypes of HBEGF rs4150236, ITPR3 rs116454384 and combined protective genotypes.
(a) Kaplan–Meier survival curves with additive model for the overall survival of HBEGF rs4150236 genotypes and (b) dominate model; (c) Kaplan–Meier survival curves with additive model for the disease- specific survival of HBEGF rs4150236 genotypes and (d) dominate model; (e) Kaplan–Meier survival curves with additive model for the overall survival of ITPR3 rs116454384 genotypes and (f) dominate model; (g) Kaplan–Meier survival curves with additive model for the disease- specific survival of ITPR3 rs116454384 genotypes and (h) dominate model; (i) Kaplan–Meier survival curves for the overall survival of the combined protective genotypes and (j) dichotomized groups of the NPG in the PLCO dataset; (k) Kaplan–Meier survival curves for the disease- specific survival of the combined protective genotypes and (l) dichotomized groups of the NPG in the PLCO dataset.
Abbreviations: NPG, number of protective genotypes; PLCO, The Prostate, Lung, Colorectal and Ovarian Cancer Screening Trial.
