
Fig. 4.
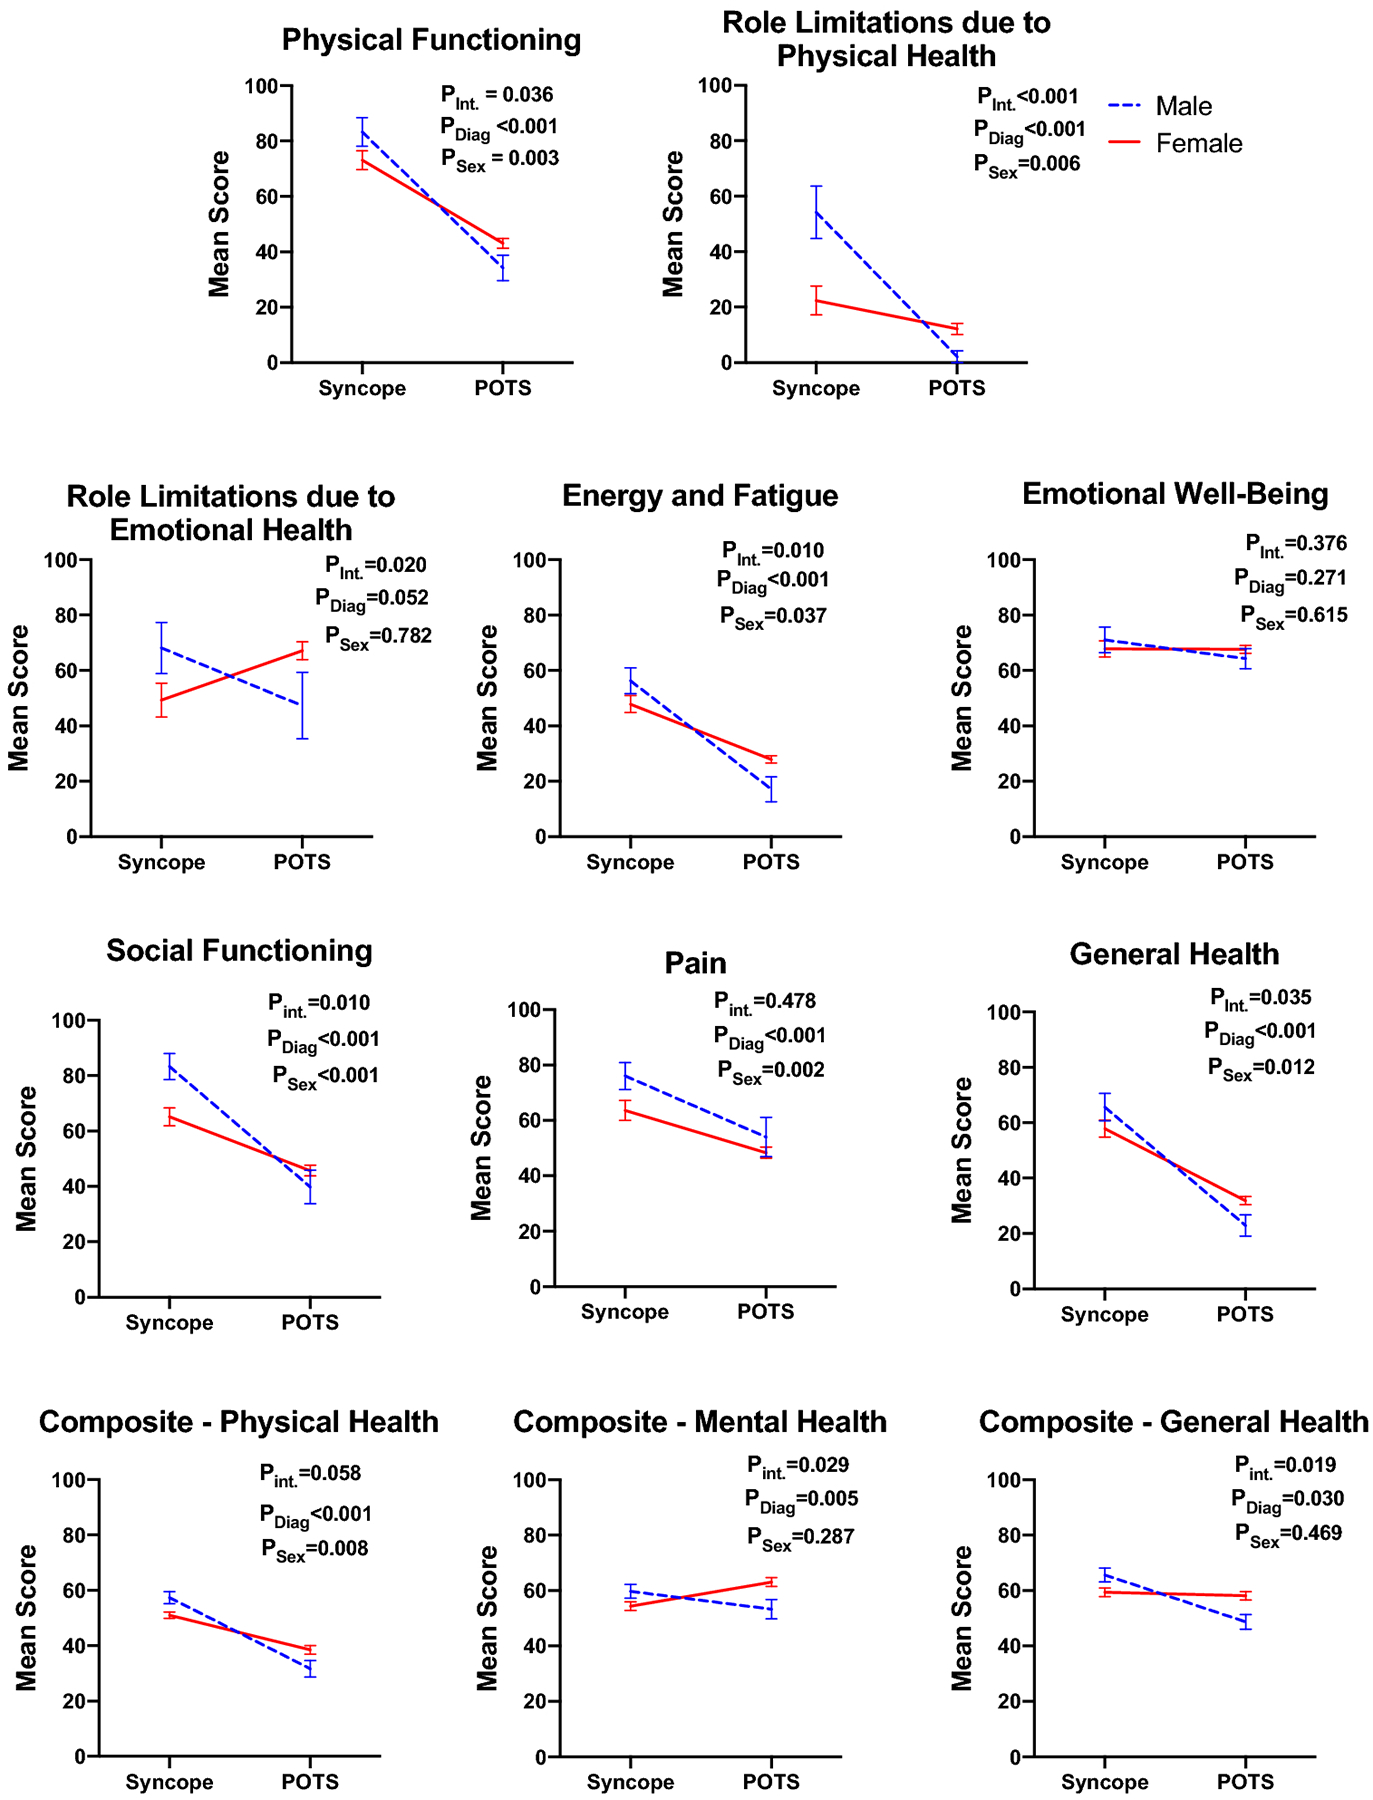
Interactions between Diagnosis (POTS and VVS) and Sex (male and female) on RAND36 Health Related Quality of Life scores. Diagnosis plotted against mean ± SEM RAND36 score. Plotted lines represent sex: the solid red line for female and the segmented blue line for male. Each diagnosis is distinct. Data were analyzed via two-factor ANOVA to examine main effects of POTS versus VVS diagnosis (PDiag) and male versus female regardless of diagnosis (Psex), and their interaction (Pint.). POTS: Postural Tachycardia Syndrome; VVS: vasovagal syncope.