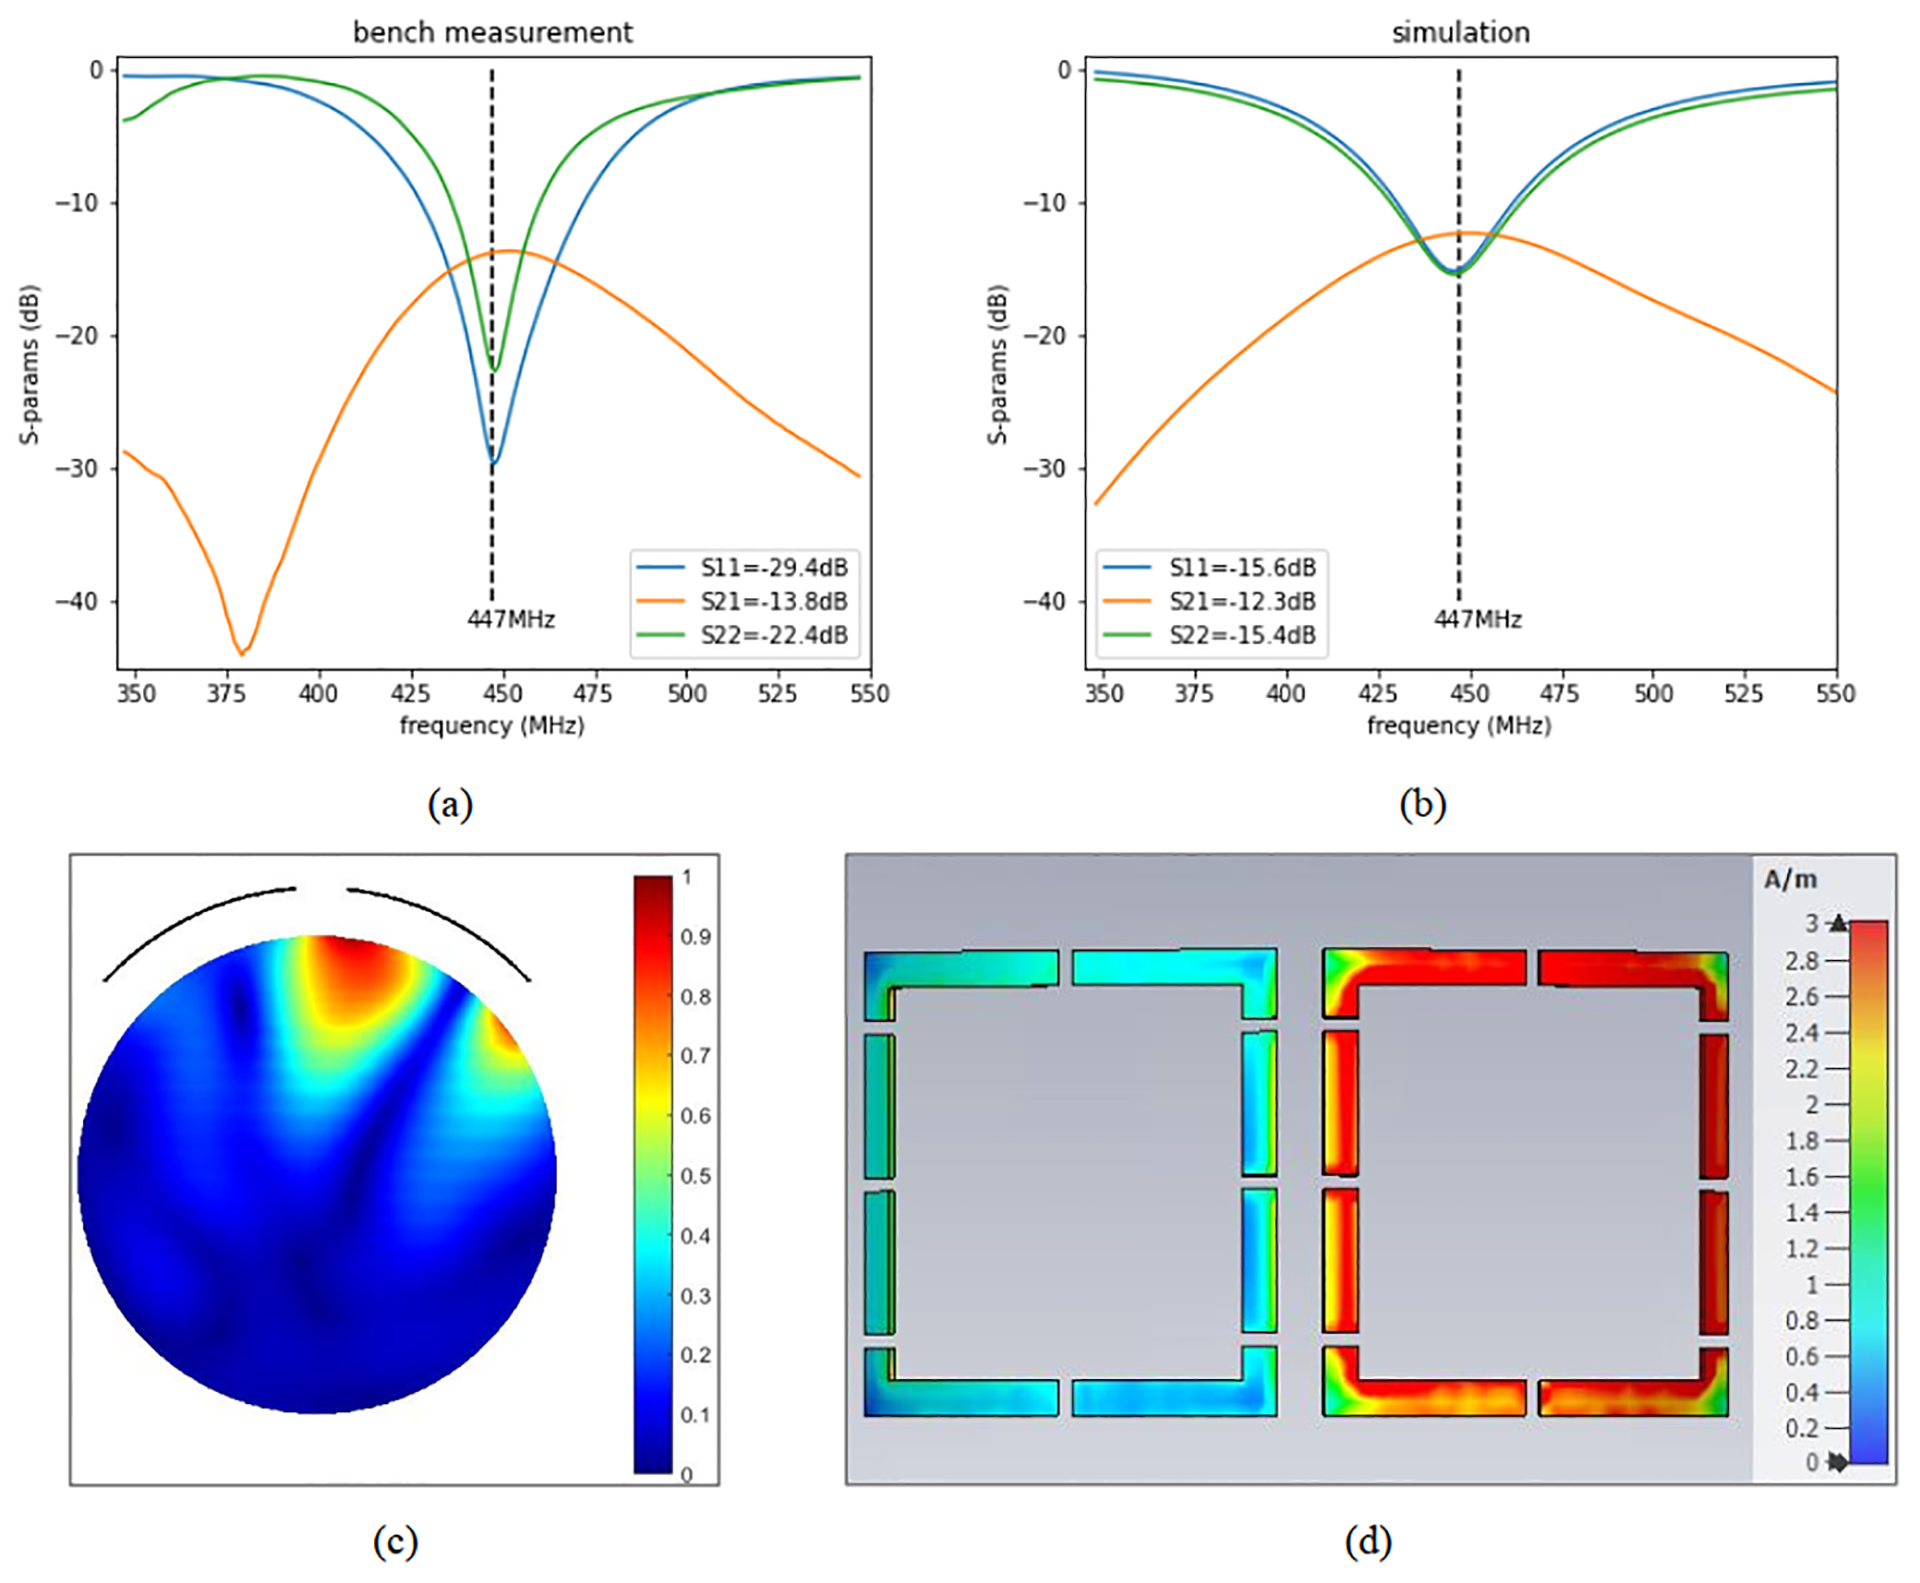
FIGURE 2.

Experimental S-parameters (measured on the bench) demonstrating self-decoupling of adjacent loops (A), simulated S-parameters (B), magnitude B1 field of one loop (axial, center slice, normalized to 1, showing the location of the loops as arcs) (C), and average magnitude surface current distribution (when only the right loop is excited) (D). The Sij values included in (A) and (B) are at 447 MHz
