Figure 4:

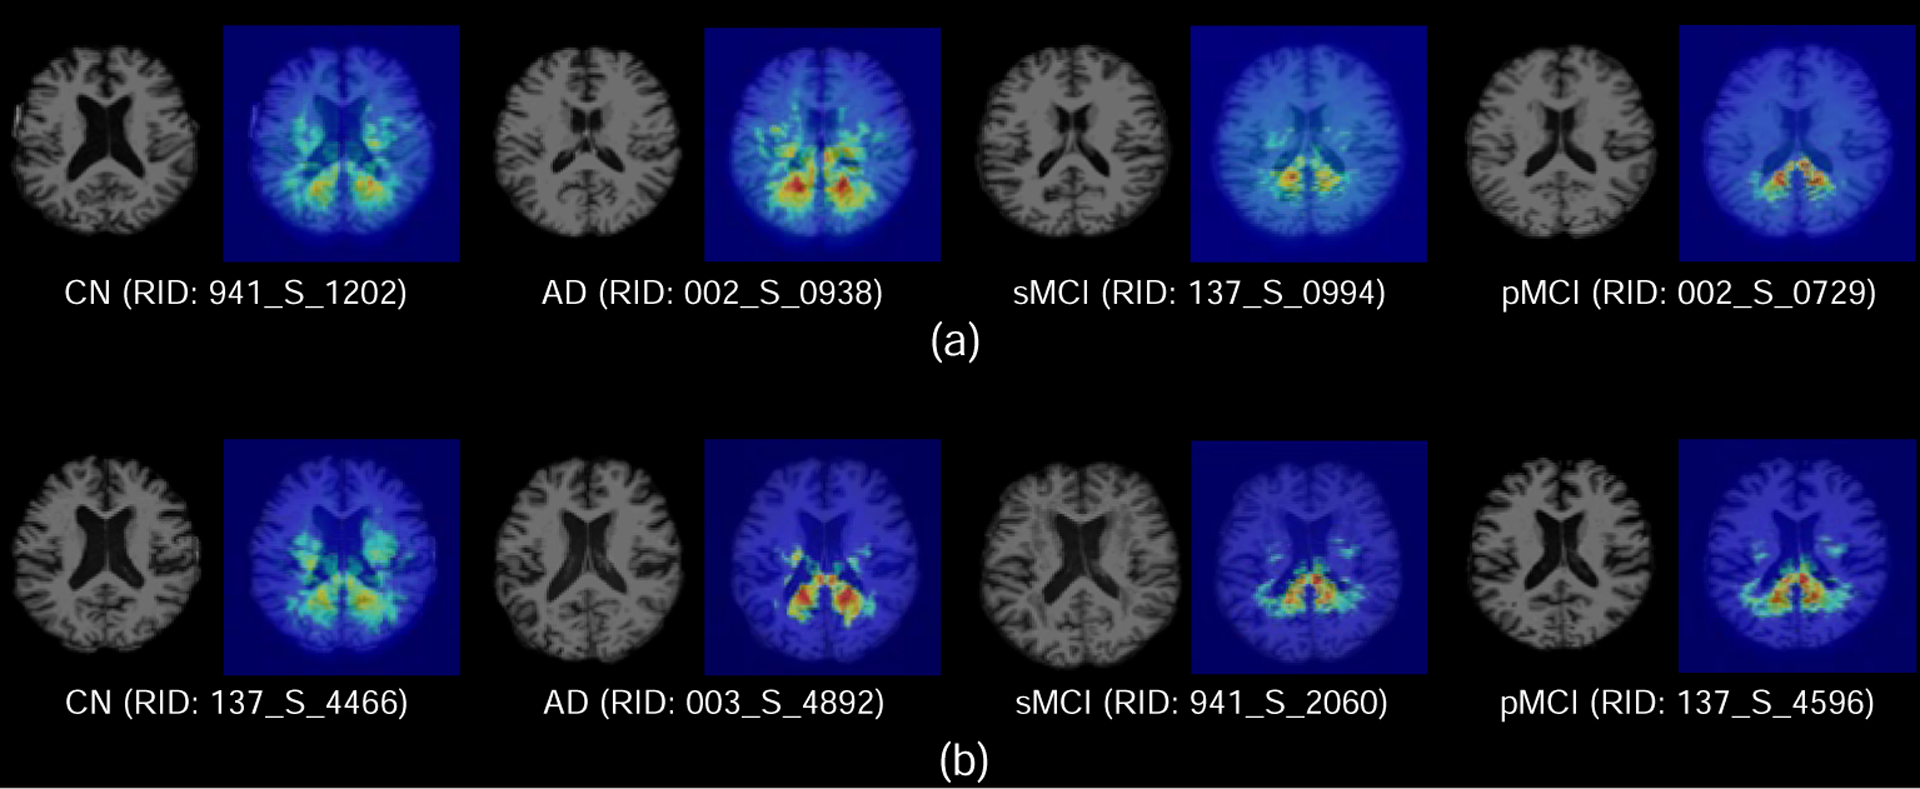
Attention maps generated by our AD2A for eight typical subjects from ADNI-1 (a) and ADNI-2 (b). The red and blue denote the high and low discriminative capability of brain regions in disease identification, respectively.

Attention maps generated by our AD2A for eight typical subjects from ADNI-1 (a) and ADNI-2 (b). The red and blue denote the high and low discriminative capability of brain regions in disease identification, respectively.