
Figure 5:
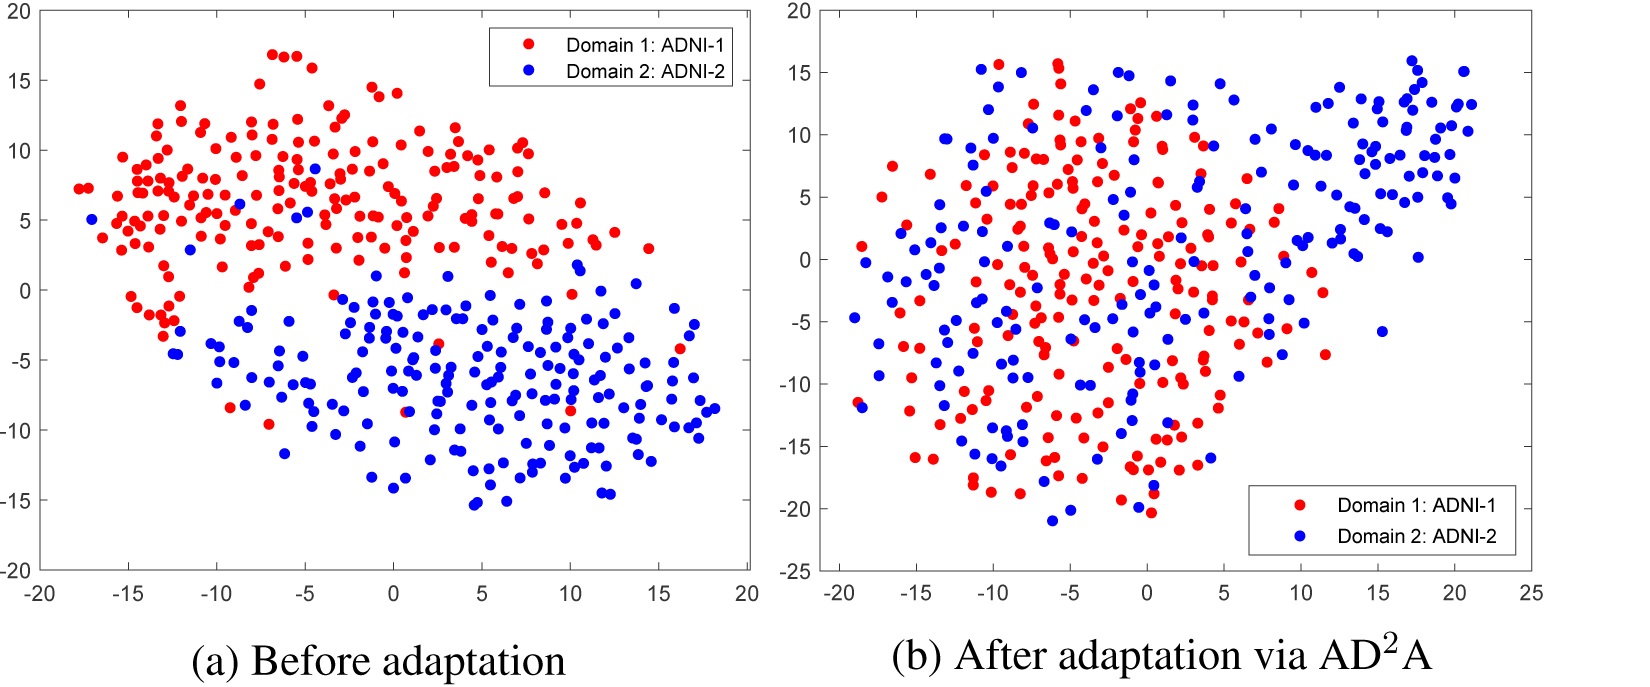
Visualization of (a) the original distribution and (b) the distribution after adaptation via our proposed AD2A for two structural MRI datasets (i.e., ADNI-1, ADNI-2).
Official websites use .gov
A
.gov website belongs to an official
government organization in the United States.
Secure .gov websites use HTTPS
A lock (
) or https:// means you've safely
connected to the .gov website. Share sensitive
information only on official, secure websites.
Visualization of (a) the original distribution and (b) the distribution after adaptation via our proposed AD2A for two structural MRI datasets (i.e., ADNI-1, ADNI-2).