
Fig. 3.
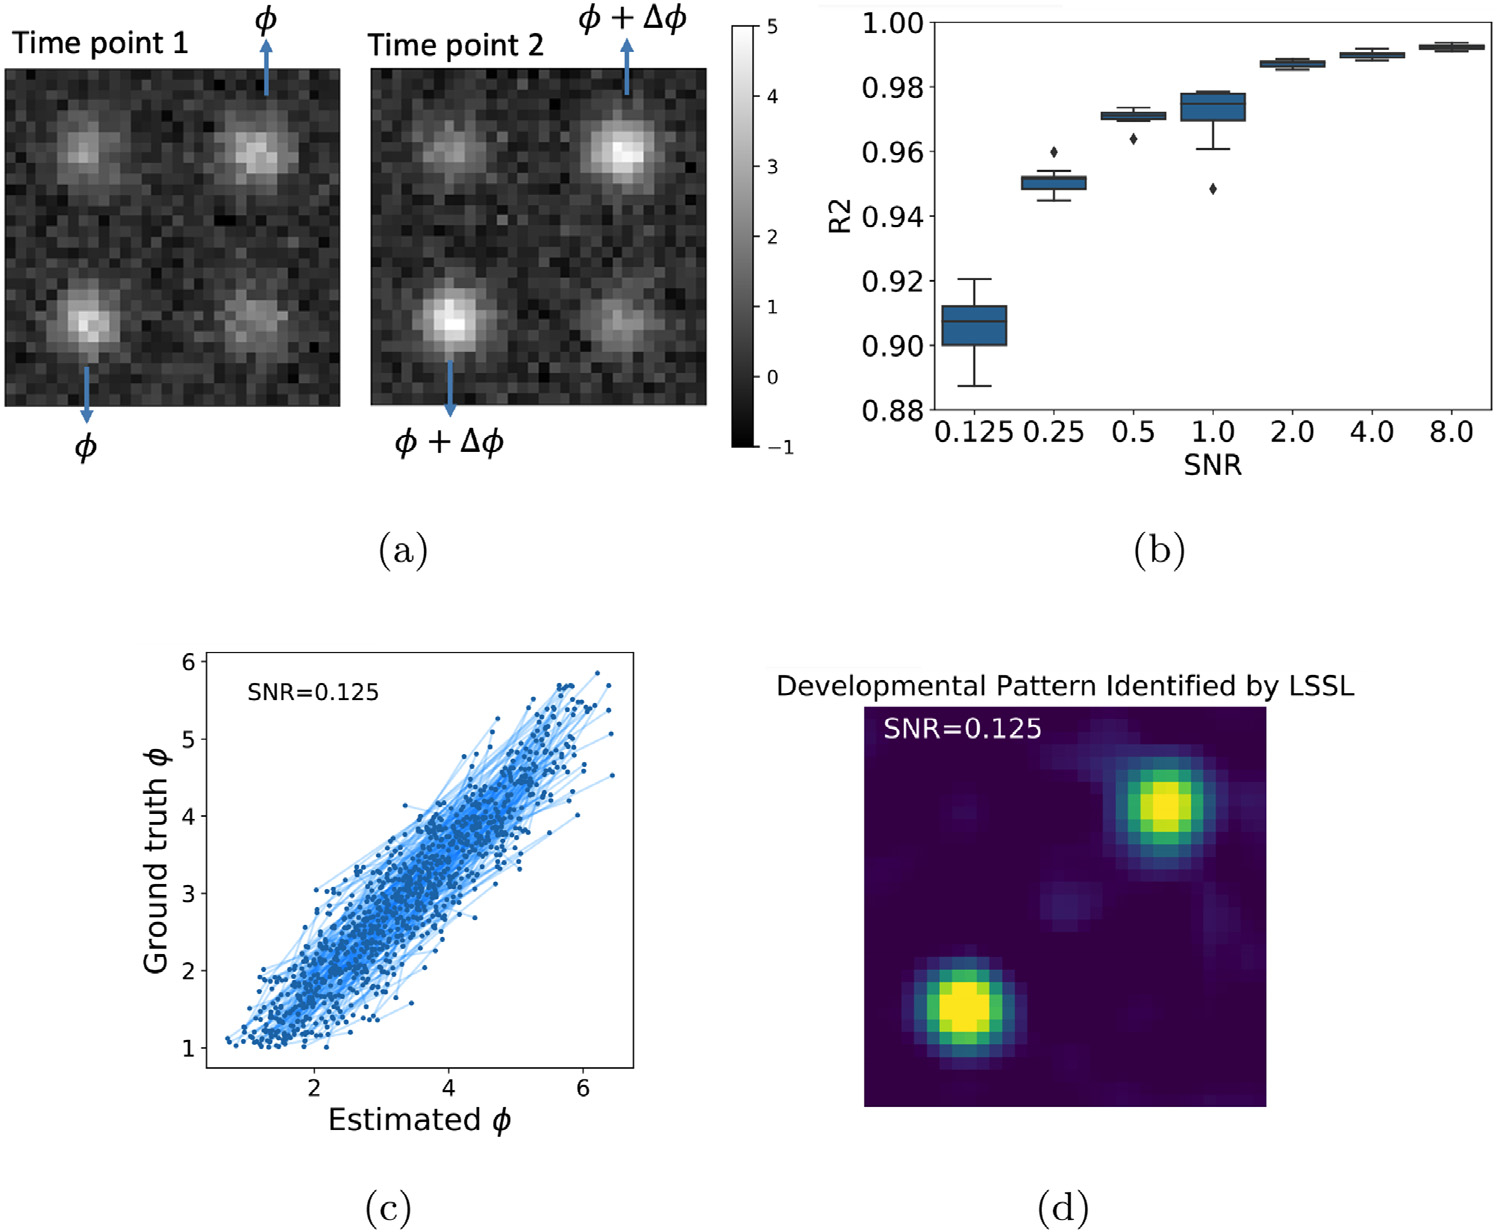
(a) A synthetic image pair representing a subject’s developmental effects, which were quantified by the magnitude change Δϕ of the two off-diagonal Gaussians; (b) R2 between estimated and ground-truth ϕ with respect to noise level; (c) Group-level correlation for SNR = 0.125. Each line connects two points associated with an image pair; (d) Identified developmental patterns for SNR = 0.125.