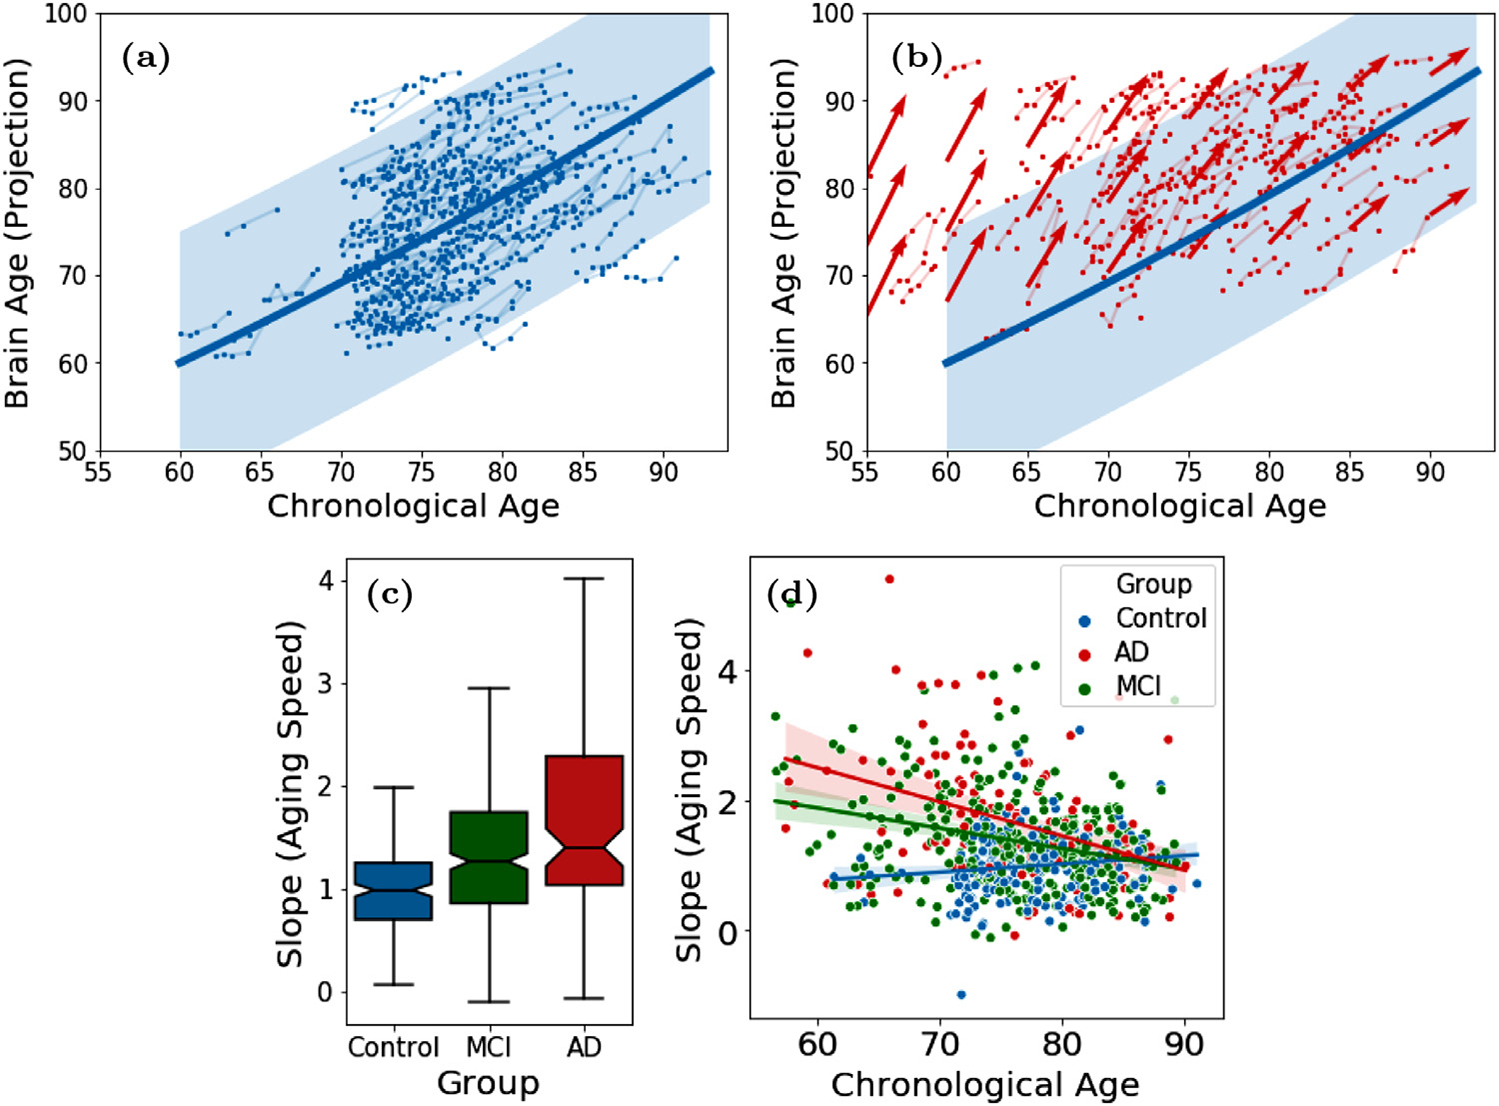
Fig. 4.

(a) Brain age of 229 control subjects from ADNI1; (b) Brain age of 185 AD patients (red) overlaid with normal developmental trajectory (blue); (c) Speed of brain aging (slope of ψ over time) for the 3 diagnosis groups and (d) as a function of chronological age of the ADNI1 subjects.
