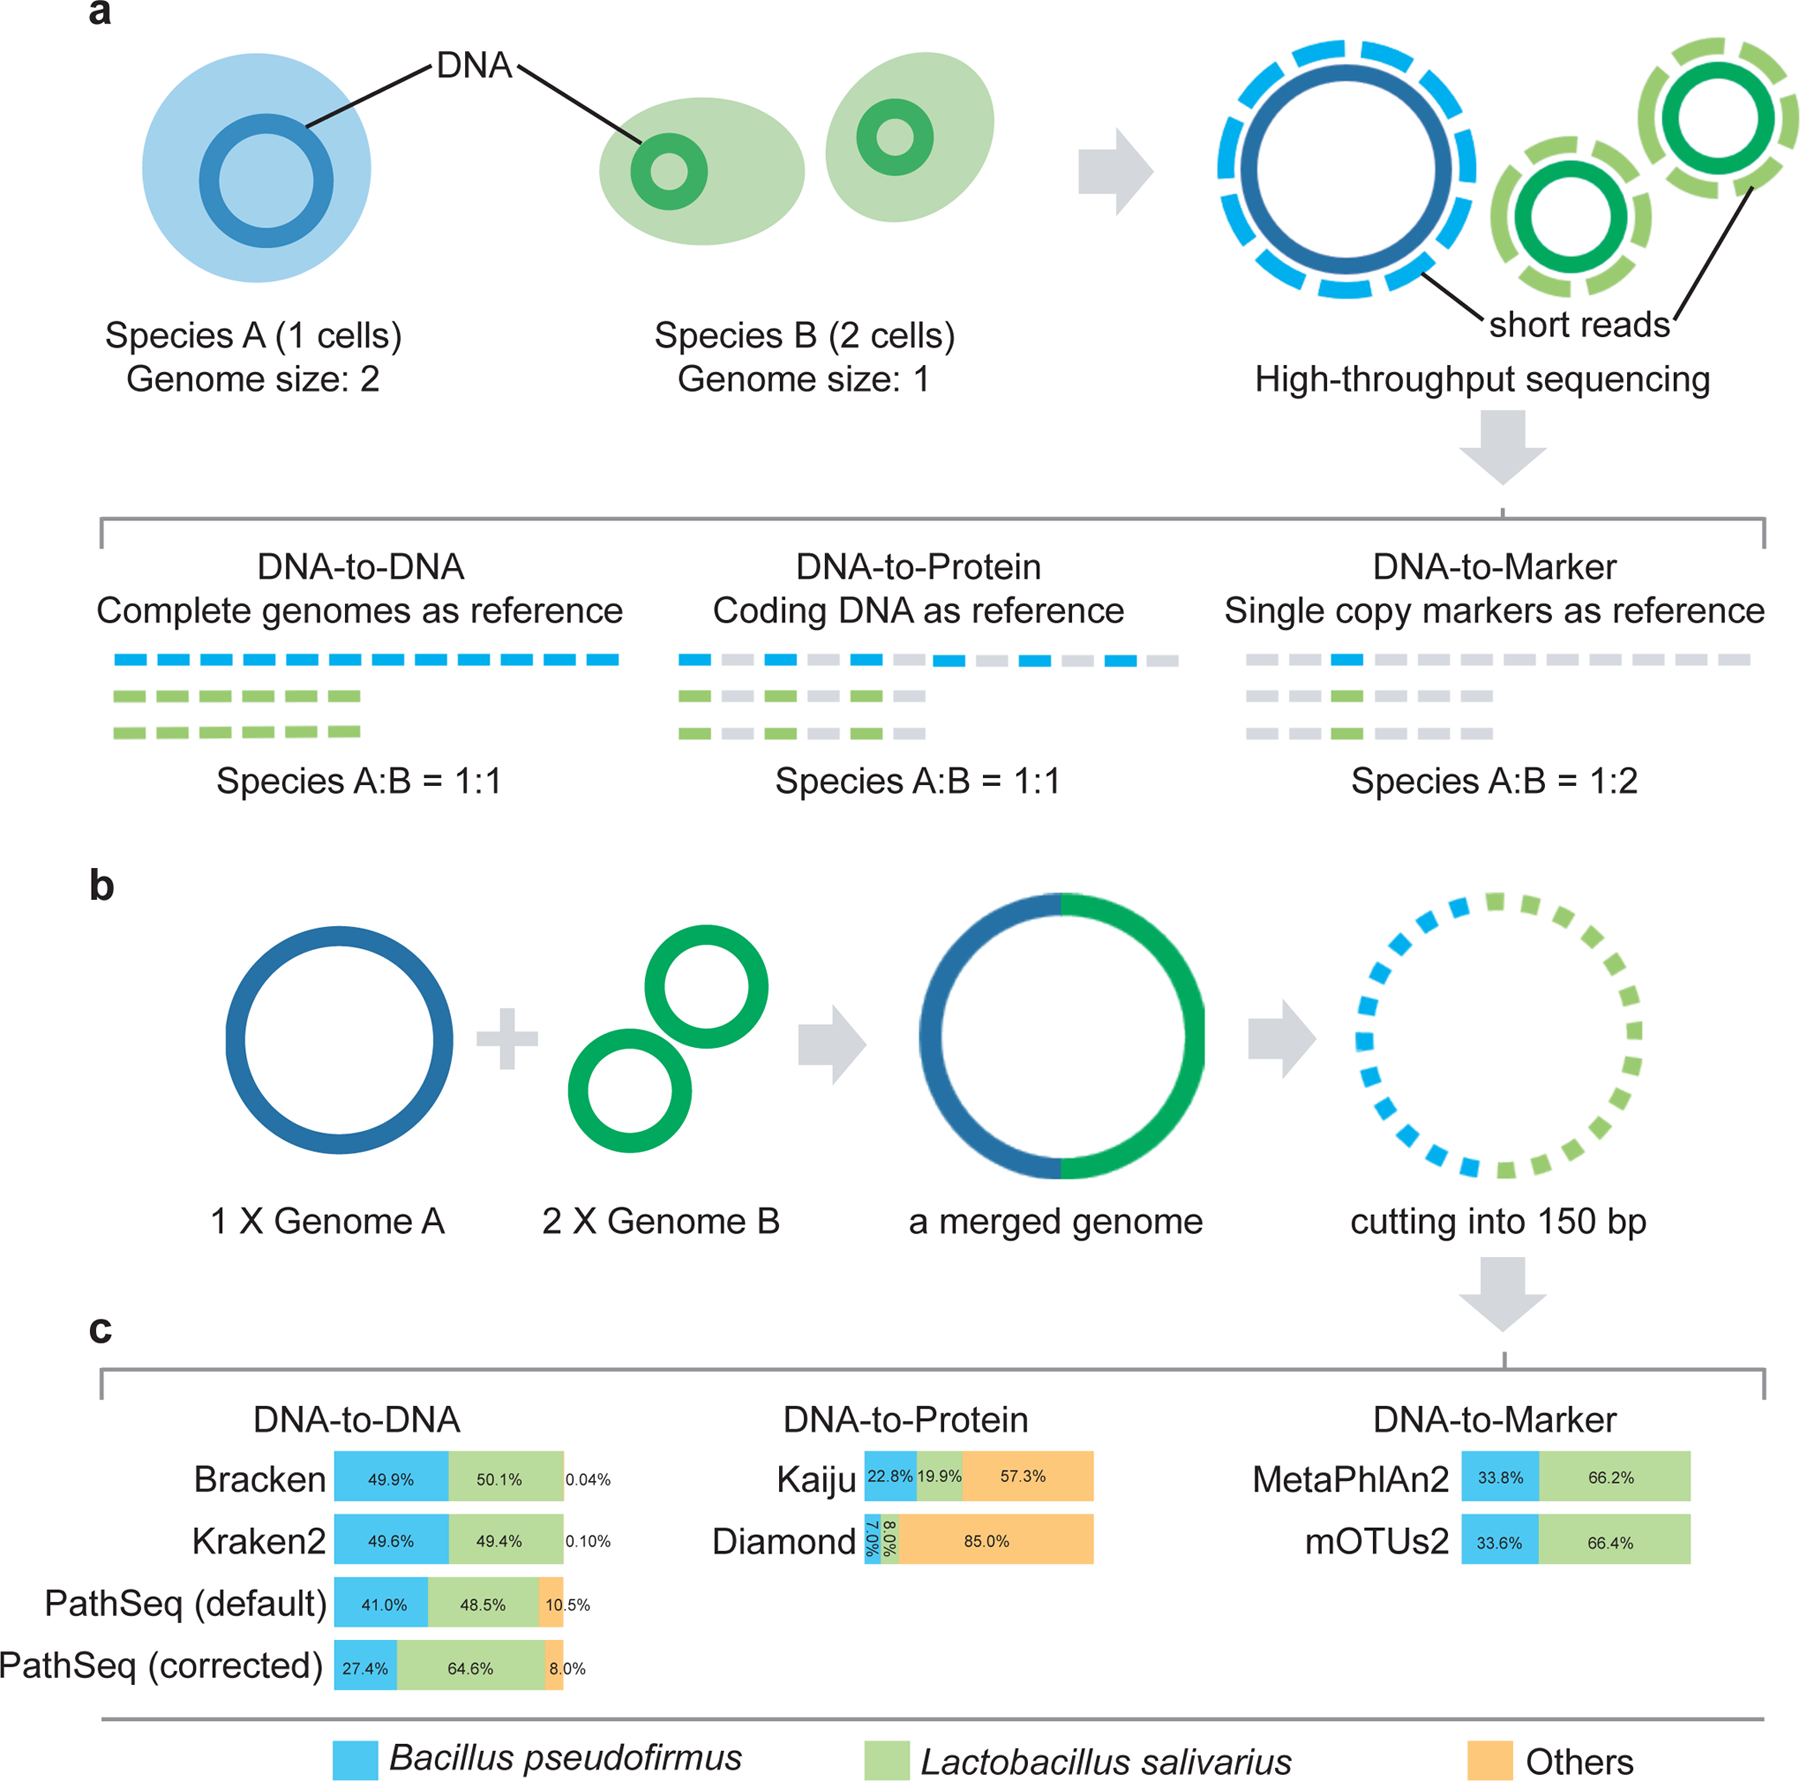
Figure 1. Comparison of profiling results.

a, Illustration of the reference databases and the default output abundance type for DNA-to-DNA, DNA-to-Protein and DNA-to-Marker profilers on a mixture of two species A (1 cell) and B (2 cells). b, A simulated microbial community with only two genomes: Bacillus pseudofirmus (genome size 4.2MB) and Lactobacillus salivarius (genome size 2.1MB). We merged one copy of Bacillus pseudofirmus genome (genome A) with two copies of Lactobacillus salivarius genome (genome B) sequences into one metagenome file. Then we sheared the merged metagenomic sequences into 150bp to simulate a typical metagenomic dataset. c, Profiling results (default output) of different profilers for the simulated microbial community. The bar plots show the estimated relative abundance of the two microbial members A and B using different metagenomics profilers. PathSeq (default) represents the profiling result generated by the default setting of PathSeq (without genome-length correction). PathSeq (corrected) represents the profiling result of PathSeq with the parameter “--divide-by-genome-length” (i.e., genome-length correction) enabled.
