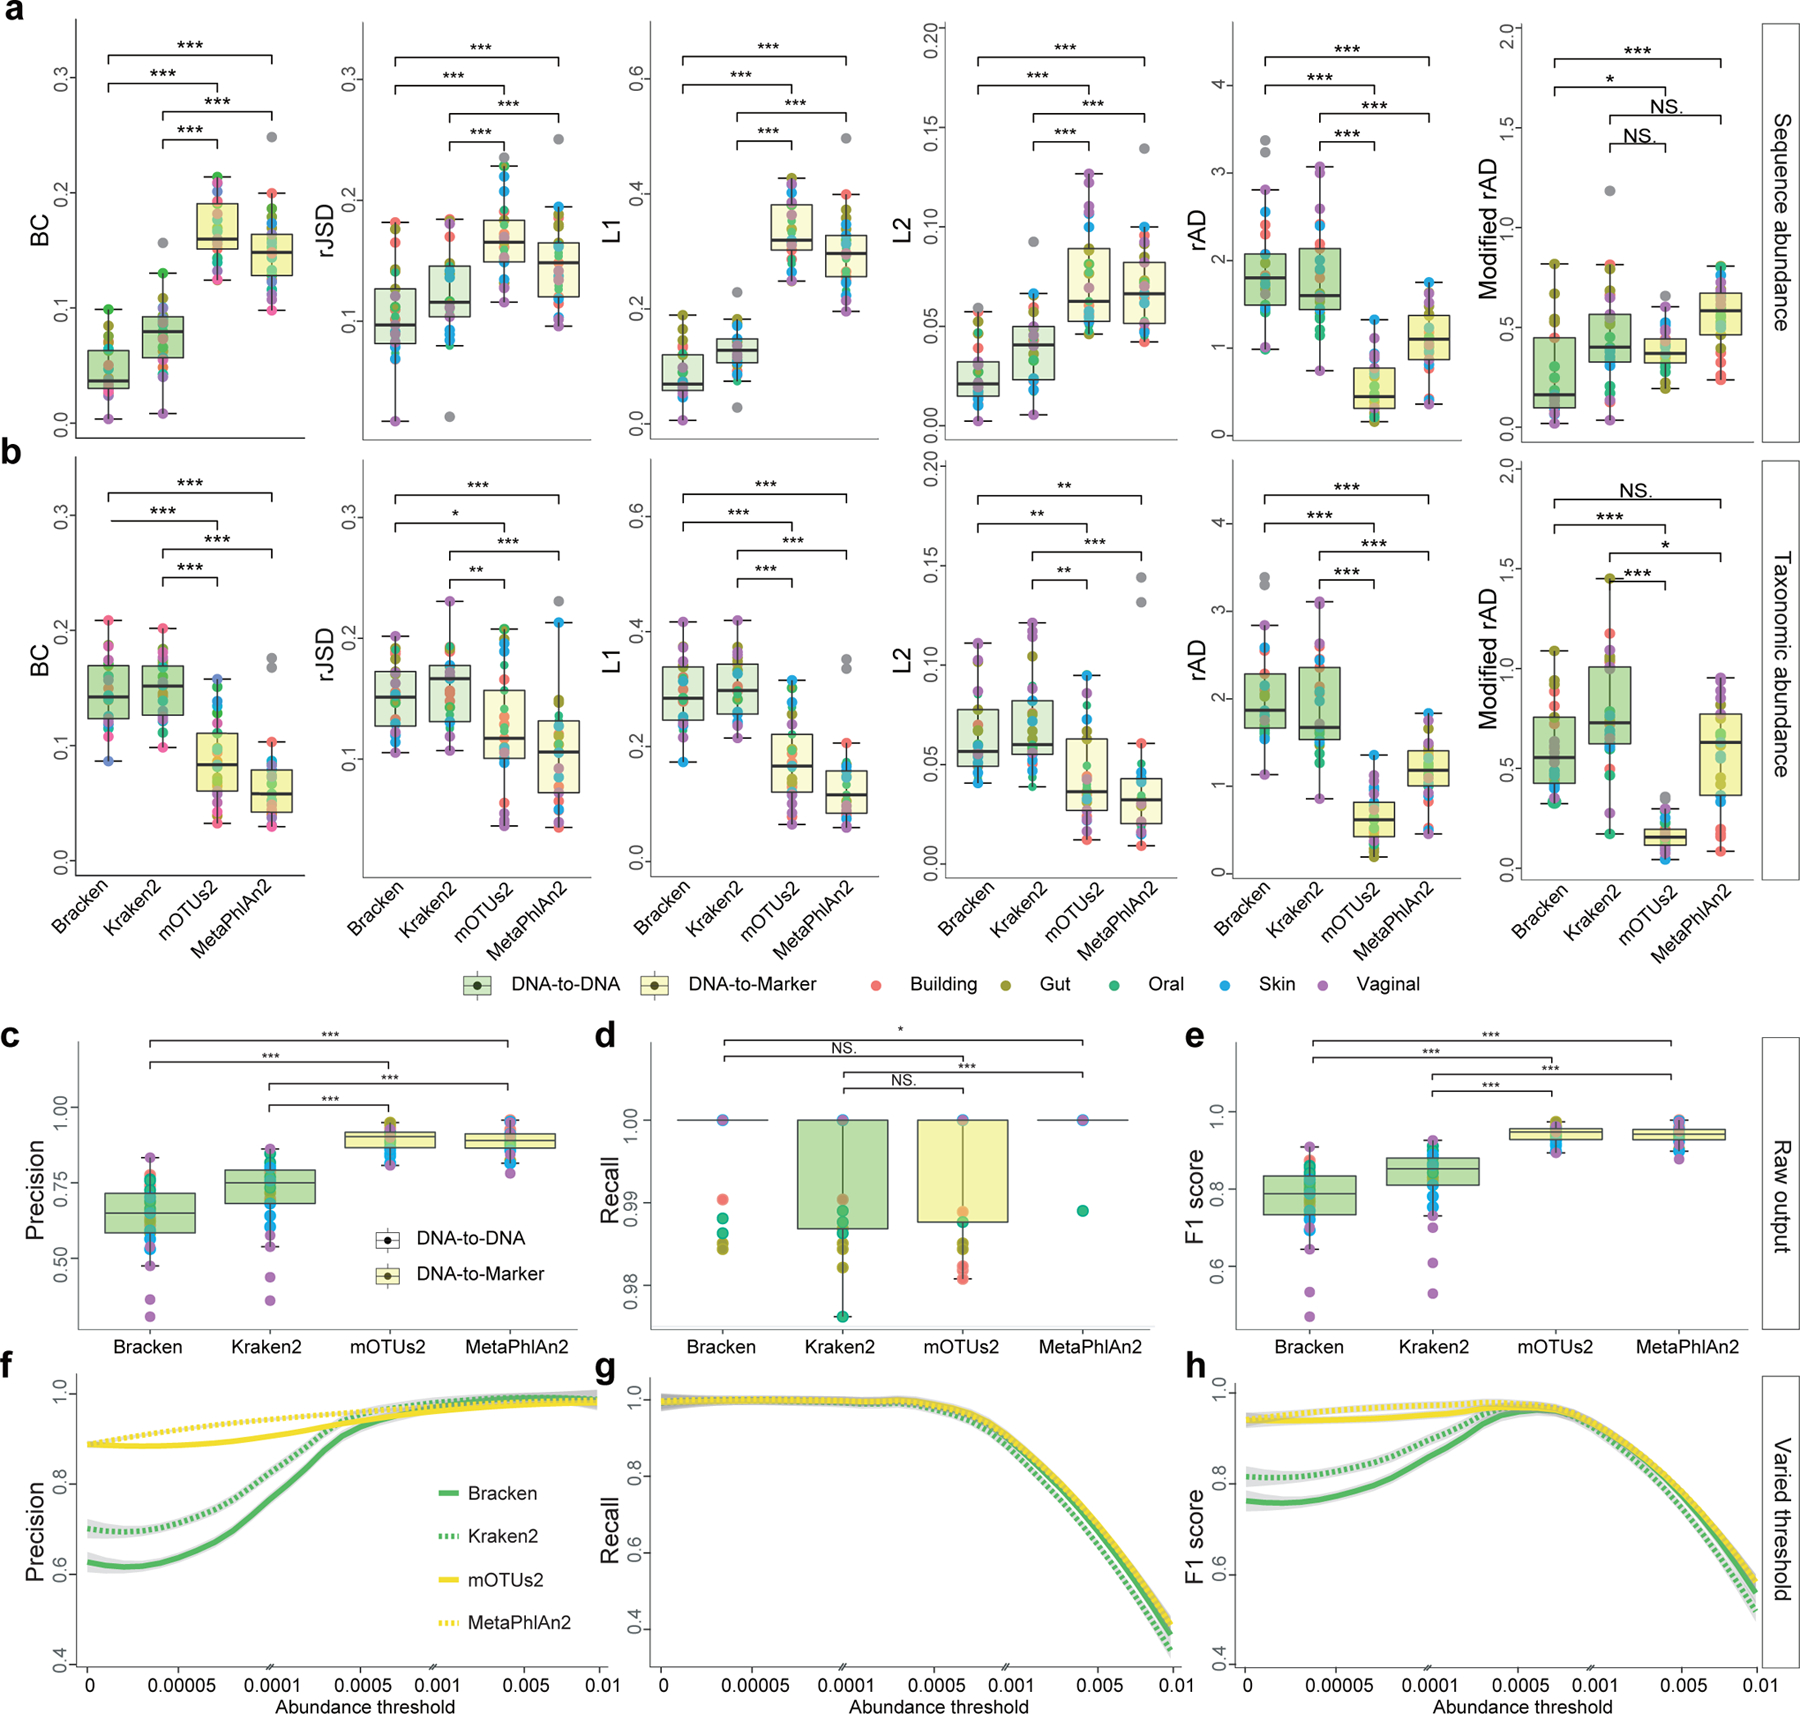
Figure 3. Quantitative and qualitative benchmarking results of four representative metagenomic profilers using 25 simulated communities.

a-b: Differential benchmarking results of four representative metagenomics profilers using two types of relative abundance as ground truth: sequence abundance (a) and taxonomic abundance (b). The boxplots indicate the dissimilarities based on L1, L2, root Jensen-Shannon divergence (rJSD), Bray-Curtis (BC), and robust Aitchison distance (rAD) between the ground-truth profiles and the profiles predicted by different metagenomics profilers (Bracken, Kraken2, mOTUs2, and MetaPhlAn2) at the species level. For each metagenomic profiler, we performed the dissimilarity calculations based on 25 simulated microbial communities from five representative environmental habitats (gut, oral, skin, vagina and building) separately. Note that for each profiler based on any evaluation metric, its performance variation across different synthetic communities is due to microbiome complexity difference (e.g., species composition and richness). c-d: Precision-recall analysis. c-e: Boxplots indicate the precision (c), recall (d), and F1 score (e) based on the default profiling results of four metagenomic profilers (without any abundance thresholding) using either sequence abundance (green) or taxonomic abundance (yellow) as the ground truth. f-h: The change of the precision (f), recall (g), and F1 score (h) with abundance threshold tuned from 0 to 0.01. Each dot represents the microbial profile of a simulated community, n = 25 simulated datasets. Significance levels: p-value<0.05 (*), <0.01 (**), <0.001 (***), NS (non-significance); two-sided Wilcoxon signed-rank test. Exact p-values are provided in the Source Data File. The lower and upper hinges correspond to the first and third quartiles, and the center refers to the median value. The upper (or lower) whisker extends from the hinge to the largest (smallest) value no further (at most) than 1.5 * IQR from the hinge. Data beyond the end of the whiskers are plotted individually.
