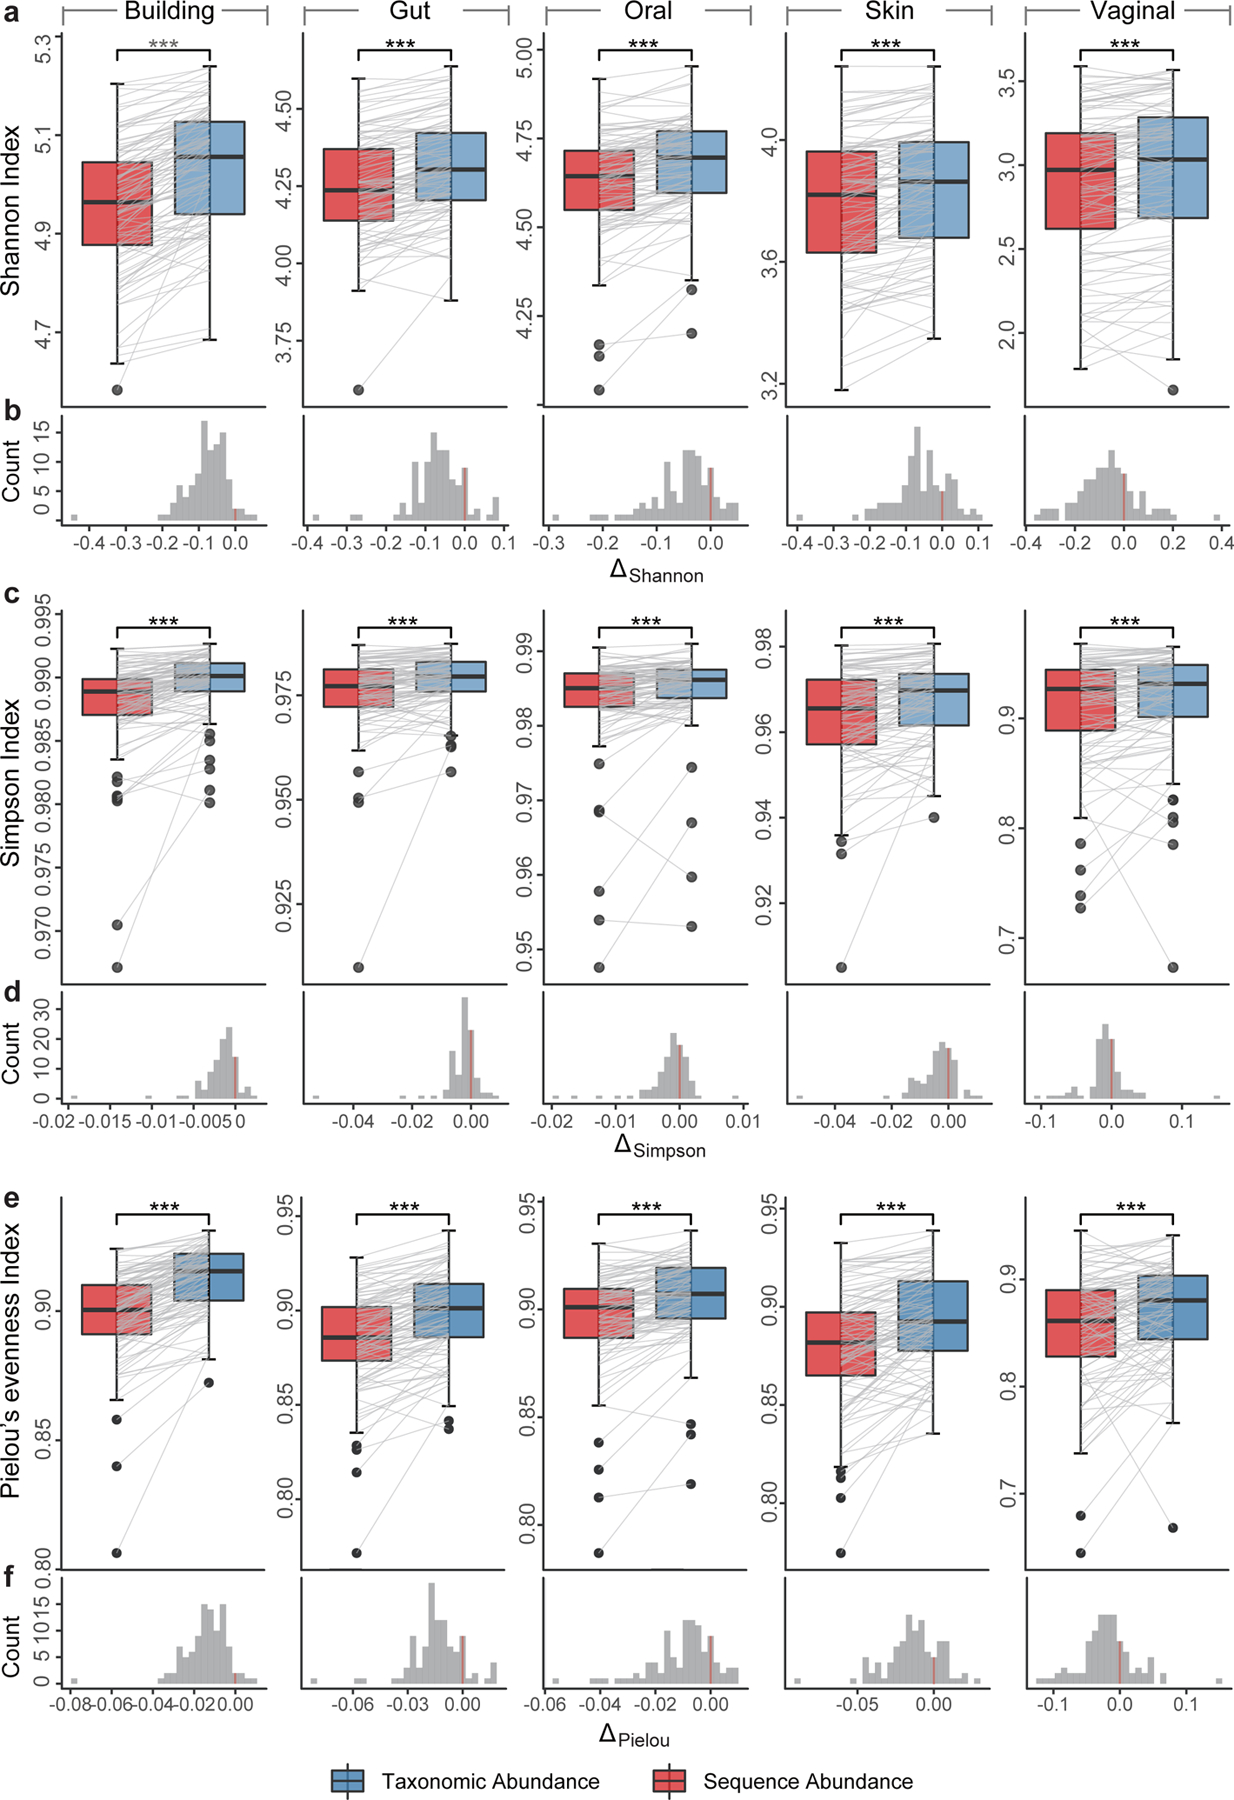
Figure 4. Alpha diversity based on sequence abundance and taxonomic abundance.

Alpha diversity (a-b: Shannon index; c-d: Simpson index; and e-f: Pielou’s evenness index) based on ground truth of simulated data from different habitats, and the histogram of the alpha-diversity difference calculated from two different abundance types. For each sample, the indices calculated from two abundance types were connected by a gray line to illustrate their difference. Significance levels: p-value<0.05 (*), <0.01 (**), <0.001 (***), NS (non-significance); two-sided Wilcoxon signed-rank test. Exact p-values are provided in the Source Data File.
