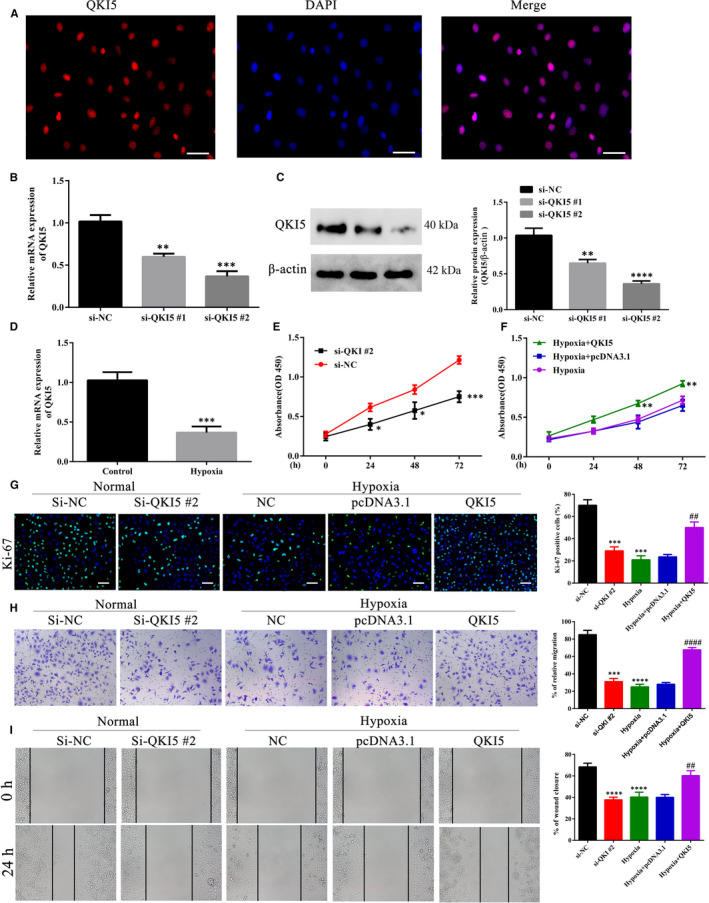
FIGURE 2.

QKI5 promotes cell proliferation and migration in HTR‐8/SVneo cells during hypoxia. A, Representative micrographs of HTR‐8/SVneo cells showing the subcellular distribution of QKI5. HTR‐8/SVneo cells were fixed, permeabilized and stained with anti‐QKI5 primary antibody followed by Cy3‐labeled secondary antibody. The nuclei were stained using 4′,6‐diamidino‐2‐phenylindole (DAPI) and visualized by epifluorescence. Scale bar: 20 μm. B, Relative mRNA expression of QKI5 upon siRNA knockdown of QKI5 using two different targets. A scrambled non‐targeting siRNA (NC) was used as a control. The cells were transfected with siRNA for 24 h, then harvested for total RNA extraction, followed by cDNA synthesis and analysed by qPCR. C, Representative Western blotting (left) and densitometric quantification of cells used in panel B. D, QKI5 mRNA expression evaluated by qPCR in HTR‐8/SVneo cells cultured under normal and hypoxic conditions. E‐F, Cell proliferation of HTR‐8/SVneo cells upon knockdown or overexpression of QKI5. At 24 h post‐transfection by si‐QKI5 or the QKI5 overexpression plasmid, cell proliferation at the indicated time‐points (0 h, 24 h, 48 h and 72 h) was detected using MTT assays during normal and hypoxia conditions. Absorbance was measured at 450 nm. G, Representative merged micrographs and quantification of HTR‐8/SVneo cells upon knockdown or overexpression of QKI5 under normal or hypoxia conditions, respectively. At 24 h post‐transfection, the cells were stained with the Ki‐67 proliferation marker (green) and the nucleus was stained with DAPI (blue). At least 100 cells were counted per condition, per experiment. Scale bar: 50 μm. H‐I, Cell migration and wound healing assays. At 24 h post‐transfection using siRNA or the overexpression vector, HTR‐8/SVneo cells were added to the upper chamber of a Transwell system for migration towards the serum gradient. Cells migrating to the lower chamber 24 h post‐migration were stained using 0.1% Crystal Violet and counted to determine the migration. For the wound healing assay, a wound scratch was made in cells seeded in a 6‐well plate and images from different fields taken at the time of wound scratching and 72 h post‐wound scratching were compared to calculate the area of the wound closure. All bars show the means ± SD from at least three independent experiments. Statistical significance was calculated using Student's t test for comparing two groups and one‐way analysis of variance for more than two groups. *** P < .001; **** P < .0001 compared with the si‐NC group, ## and #### denote P < .01, P < .0001, respectively, compared with the hypoxia +pcDNA3.1 group
