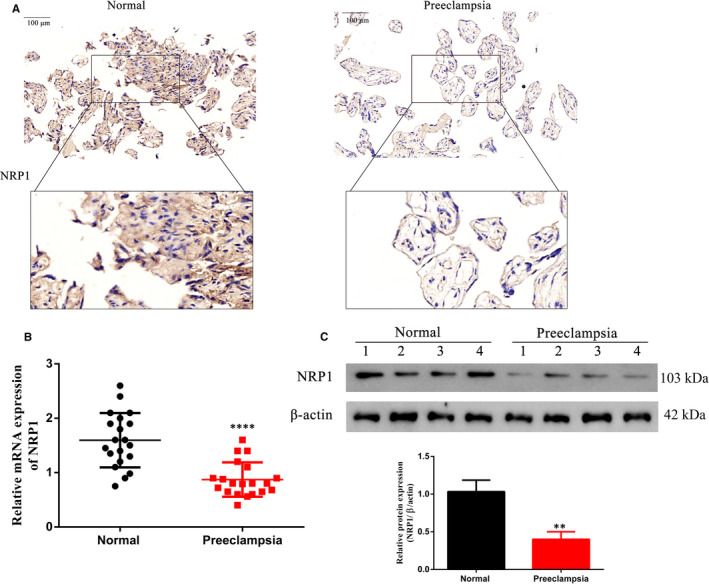
FIGURE 3.

NRP1 expression is decreased in preeclampsia (PE) placentas compared with normal healthy placentas. A, Representative images from immunohistochemistry analysis of NRP1 expression in human placentas under normal and PE conditions. Scale bar: 100 μm. B, NRP1 mRNA expression in human normal placentas and PE placentas determined by qPCR. N = 20 per group. C, Representative Western blotting (left) and densitometric quantification of NRP1 protein expression in samples shown in Figure 1C. N = 20 per group. Shown are the means ± SD from at least three independent experiments. Statistical significance was calculated using Student's t test. **** P < .0001; ** P < .01
