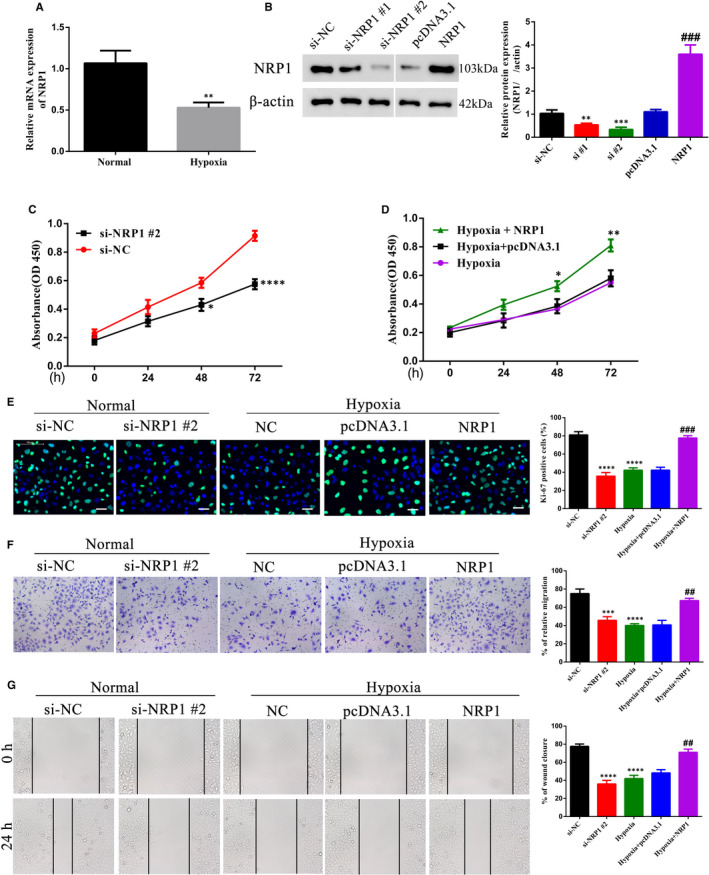
FIGURE 4.

NRP1 promotes cell migration and proliferation in trophoblasts. A, Relative NRP1 mRNA levels as detected by qPCR under normal and hypoxia conditions, ** P < .01. B, Representative Western blotting and densitometric quantification of NRP1 protein expression in HTR‐8/SVneo in non‐targeting control (NC) or NRP1 siRNA‐targeted cells. Statistics were calculated using one‐way analysis of variance. ** P < .01; *** P < .001 (compared with the si‐NC group); ### P < .001 (compared with the pcDNA3.1 group). C‐D, Proliferation efficiency using the MTT assay measured as absorbance at 450 nm of trophoblast cells under normal and hypoxia conditions at 24 h post‐transfection using NRP1 siRNA or the overexpression plasmid. Statistical significance was calculated using Student's t test for C and one‐way analysis of variance for D. * P < .05; ** P < .01; *** P < .001. E, Representative merged micrographs and quantification of HTR‐8/SVneo NC or NRP1 siRNA‐targeted cells under normal conditions and HTR‐8/SVneo cells overexpressing NRP1 during hypoxia stained with the Ki‐67 proliferation marker (green). Nuclei were stained with DAPI (blue). At least 100 cells were counted per condition, per experiment. Scale bar: 50 μm F‐G, Cell migration efficiency. HTR‐8/SVneo NC or NRP1 siRNA‐targeted cells under normal conditions or HTR‐8/SVneo cells overexpressing NRP1 during hypoxia were assessed for their abilities to migrate in a Transwell system or by wound healing assays as mentioned in Figure 2. Shown are the means ± SD from at least three independent experiments. Statistics for panel E to G were calculated by one‐way analysis of variance. *** P < .001; **** P < .0001 (compared with the si‐NC group); ## P < .01; ### P < .001 (compared with the hypoxia +pcDNA3.1 group)
