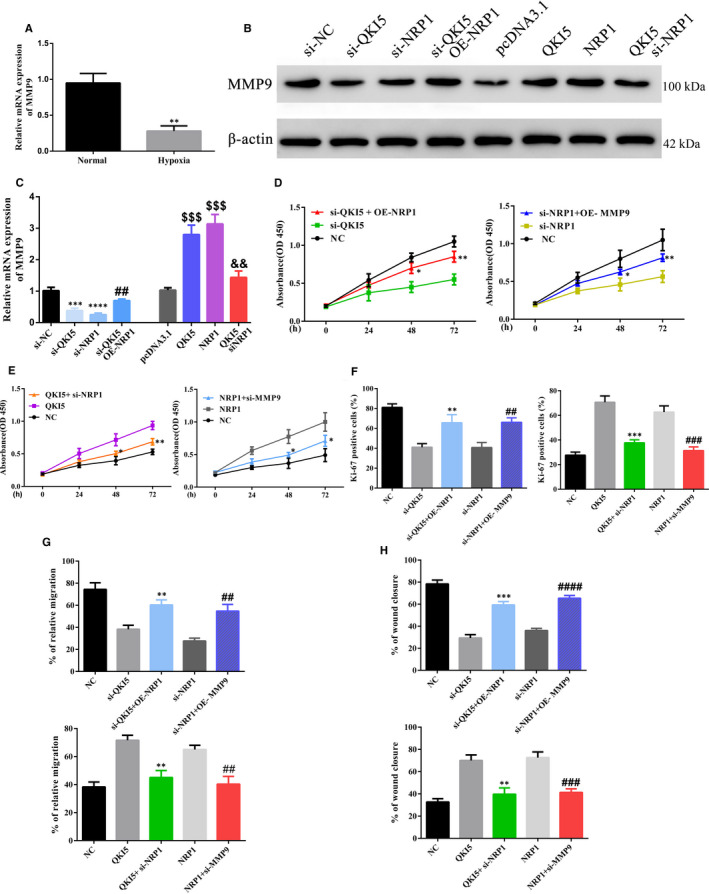
FIGURE 6.

QKI5 promotes cell proliferation and migration in trophoblasts via NRP1/MMP9. A, Relative mRNA MMP9 expression levels as determined by qPCR under normal and hypoxic conditions. B, C, Representative Western blotting and quantification of MMP9 protein expressions under different conditions in HTR‐8/SVneo cells. D‐E, Cell proliferation was determined using the MTT assay. At 24 h post‐transfection, the cells were stained with the MTT dye, and the absorbance was measured at 450 nm. F, Representative merged micrographs and quantitative analysis of cell proliferation by Ki‐67 staining. Nuclei were stained using DAPI. At least 100 cells were counted per condition, per experiment (G‐H) Cell migration and invasion assays. The relative percentage migration and invasion were calculated using the Transwell migration or wound healing assays in HTR‐8/SVneo cells under different conditions. Statistical significance was calculated using one‐way analysis of variance for all panels except A, where the two groups were compared using Student's t test. ** P < .01; *** P < .001; **** P < .0001 (compared with the non‐targeting group); ## P < .01; ### P < .001; #### P < .0001 (compared with the NRP1 or si‐NRP1 group); $$$ P < .001 (compared with the pcDNA3.1 group); in panel C, && P < .01 (compared with the NRP1 group). Shown are the means ± SD from at least three independent experiments
