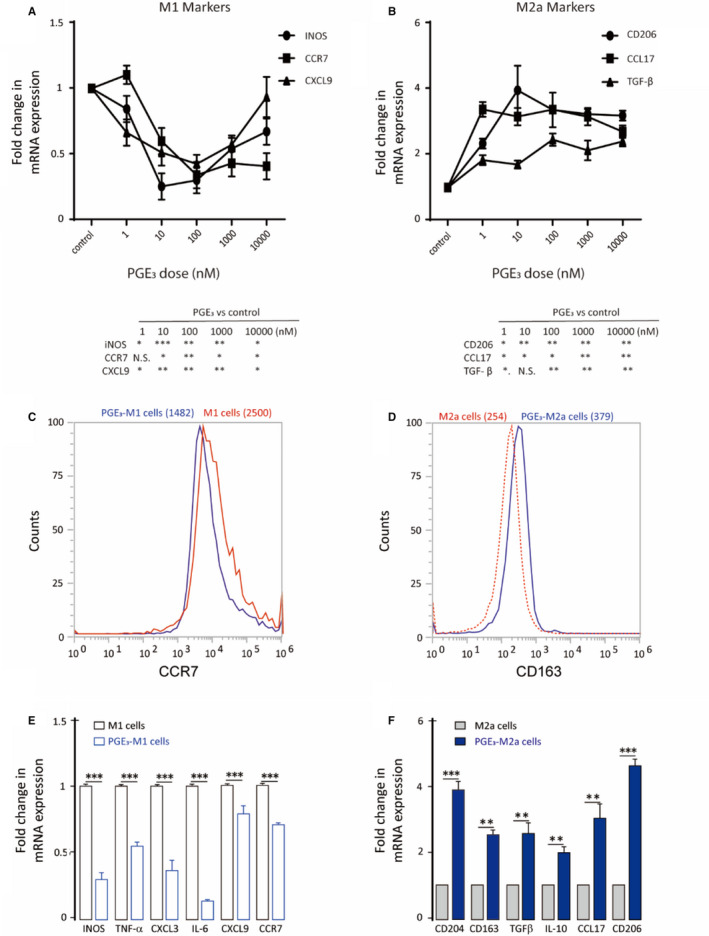
FIGURE 2.

Prostaglandin E3 suppresses M1 and induces M2a marker expression in polarized macrophages. A‐B, Dose–response of M1 and M2a markers after PGE3 treatment (1‐10 000 nmol/L). C, CCR7 protein expression in THP1‐derived M1 macrophages following PGE3 treatment (100 nmol/L). D, CD163 protein expression in THP1‐derived M2a macrophages following PGE3 treatment. E‐F, M1 and M2a marker expression following PGE3 treatment. Graphs represent means ± SD; NS, No significance, *P ≤ .05, **P ≤ .01, ***P ≤ .001
