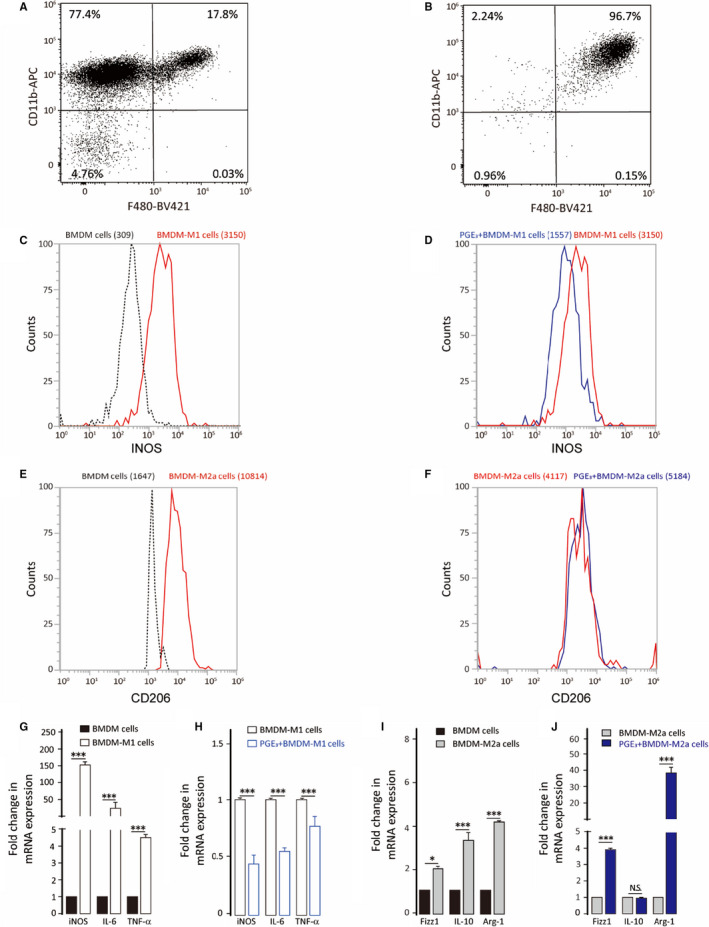
FIGURE 3.

Effect of PGE3 treatment on bone marrow‐derived macrophage polarization. BMDM cells were treated with 100 ng/mL LPS plus 20 ng/mL IFN‐γ or treated with 20 ng/mL IL‐4 for 24 h in the presence or absence of PGE3. A, BMDM cells were cultured in RPMI 1640 medium. B, BMDM cells were cultured in RPMI 1640 medium with 30% L929 cell supernatant. C‐F, M1 marker (iNOS) and M2a marker (CD206) expression were analysed by flow cytometry. G‐H, qPCR analysis of M1 (iNOS, IL6, TNFα) and M2 (Fizz1, Arg‐1, IL10) markers. Graphs represent means ± SD; NS, No significance, *P ≤ .05, ***P ≤ .001
