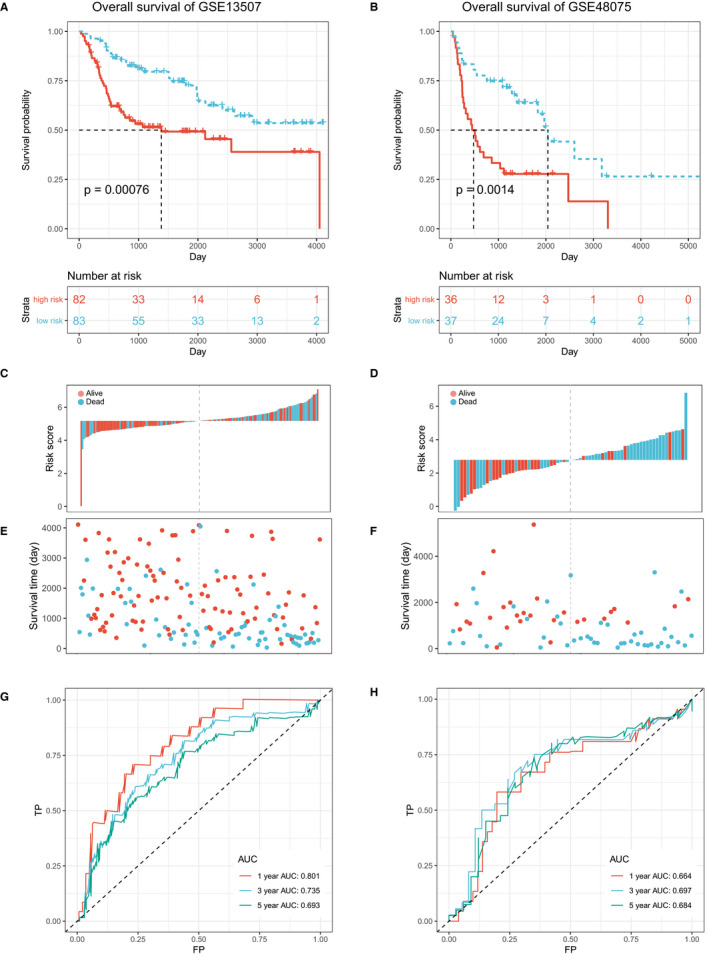
FIGURE 2.

ATGRS is a prognostic biomarker for overall survival (OS) prediction. A‐B, Kaplan‐Meier survival curves show the differences in OS advantage between ATGRS high‐risk and low‐risk groups in GSE13507 (A) and GSE48075 (B) cohorts (Log‐rank test, P = .00076, Figure 2A; P = .0014, Figure 2B). C‐D, Bar plot demonstrates that patients with high‐ATGRS risk scores have a higher mortality rate and patients with a low‐ATGRS risk scores have a higher survival rate in GSE13507 (C) and GSE48075 (D) cohorts. Blue indicates deceased patients and red indicates surviving patients. E‐F, Dot plot indicating that survival time of high‐ATGRS risk score patients is decreased compared to low‐ATGRS risk score patients in GSE13507 (E) and GSE48075 (F) cohorts. Blue indicates the ATGRS high‐risk patients and red indicates ATGRS low‐risk patients. G‐H, Time‐dependent ROC curves for ATGRS risk score in predicting OS at 1, 3, 5 y in GSE13507 (G) and GSE48075 (H) cohorts
