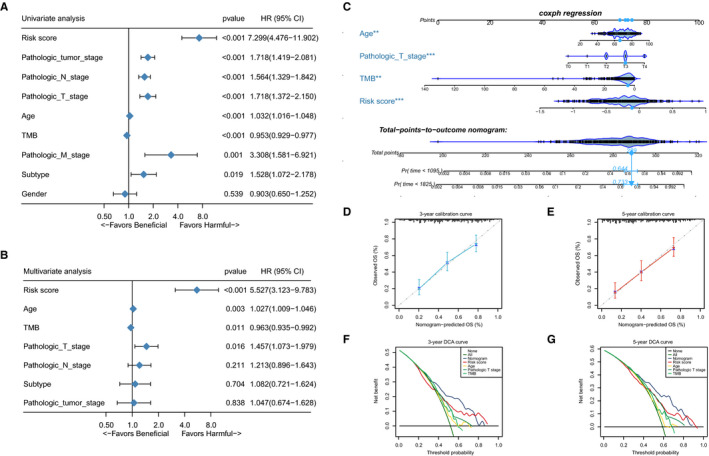
FIGURE 6.

ATGRS is an independent prognosis factor in the nomogram. A‐B, Forest plot summary of the univariate (A) and multivariable (B) cox analyses of the ATGRS risk score, clinicopathological characteristics and TMB. The results indicate four independent prognosis factors which include age, pathologic T stage, TMB and ATGRS risk score. The blue diamond on the transverse lines represent the HR, and the black transverse lines represent the 95% CI. The p value and 95% CI for each clinical feature are displayed in detail. C, Nomograms predicting the probability of patient mortality at 3‐ or 5‐y OS based on four independent prognosis factors. D‐E, Calibration curves of the nomogram for predicting probability of OS at 3, and 5 y. F‐G, Decision curve analyses (DCA) of the nomograms based on four independent prognosis factors for 3‐y and 5‐y
