FIGURE 8.

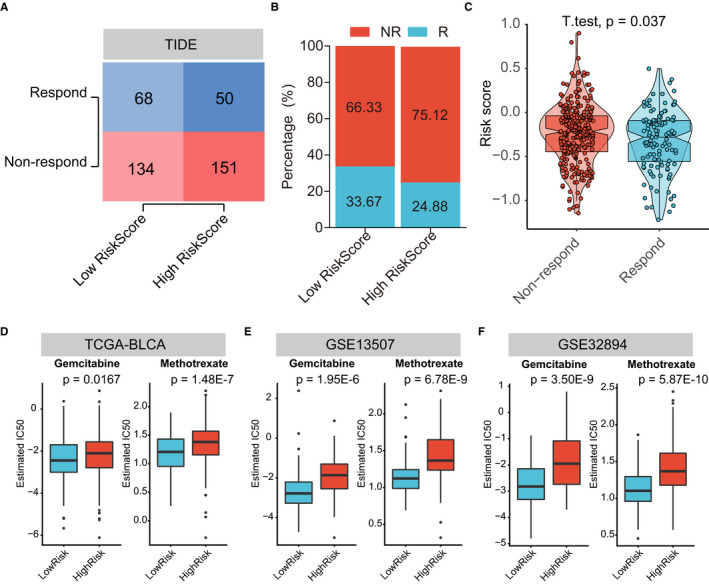
ATGRS are efficient in predicting the immunotherapeutic and chemotherapeutic benefit in BLCA. A, Number of patients with response to immunotherapy between low‐ and high‐ATGRS groups in TCGA‐BLCA cohort. The size of the colourshade represents the number. Red indicate responders; blue represents non‐responders. Two‐sided Fisher's exact tests were used to analyse contingency tables for ICIs responders (P = .0626). B, The proportion of patients which respond to immunotherapy between low‐ and high‐ATGRS groups in TCGA‐BLCA cohort. Red indicate responders; blue represents non‐responders. C, The distribution of immunotherapeutic response between high‐ and low‐risk groups stratified by ATGRS risk score in TCGA‐BLCA cohort based on the TIDE algorithm (students t test, P = .037). D‐F, Differential putative chemotherapeutic response. The box plots show differences in the estimated IC50 for gemcitabine and methotrexate between ATGRS high‐risk and low‐risk groups in TCGA‐BLCA (D), GSE13507 (E) and GSE32894 (F) cohorts
