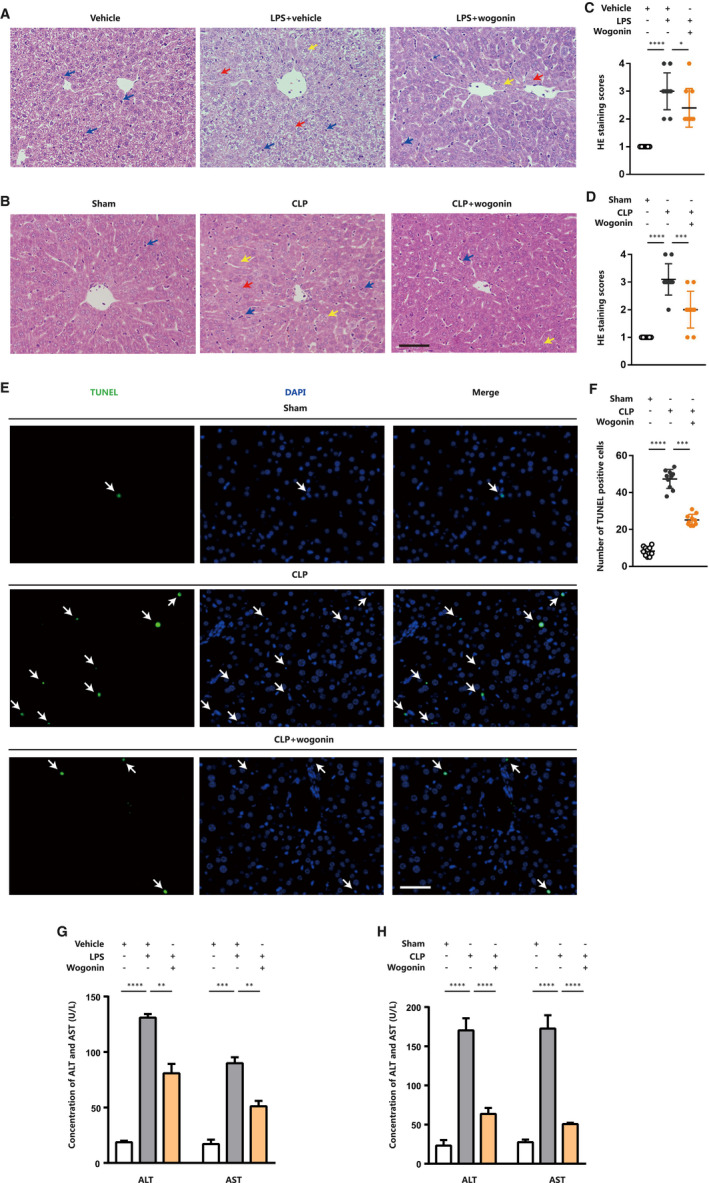
FIGURE 2.

Wogonin mitigates liver injury in mice with LPS‐ or CLP‐induced sepsis. A and B, Representative H&E staining images of liver tissue from LPS‐ and CLP‐induced sepsis mice (n = 5). The red arrows indicate obscure nucleus of hepatocytes. The yellow arrows indicate hepatocytes with vacuolar degeneration. The blue arrows indicate infiltrated neutrophils or macrophages. Magnification, 200×. Scale bar = 50 μm. C and D, H&E staining scores of liver injury in LPS‐ and CLP‐induced sepsis mice (n = 5). The number of scored fields = 10. E, Representative TUNEL staining images of liver tissue in CLP‐induced sepsis mice (n = 5). The arrows indicate the TUNEL‐positive cells. Magnification, 200×. Scale bar = 50 μm. F, The number of TUNEL‐positive cells in the liver of CLP‐induced sepsis mice with or without wogonin treatment (n = 5). The number of analysed fields = 10 (magnification, 100×). G and H, Liver injury biomarkers ALT and AST in serum of LPS‐ and CLP‐induced sepsis mice (n = 6). The concentration of wogonin was 50.0 mg/kg. Data are presented as mean ± SD through at least 3 independent experiments and were analysed by one‐way analysis of variance (ANOVA). *P < .05, **P < .01, ***P < .001, ****P < .0001
