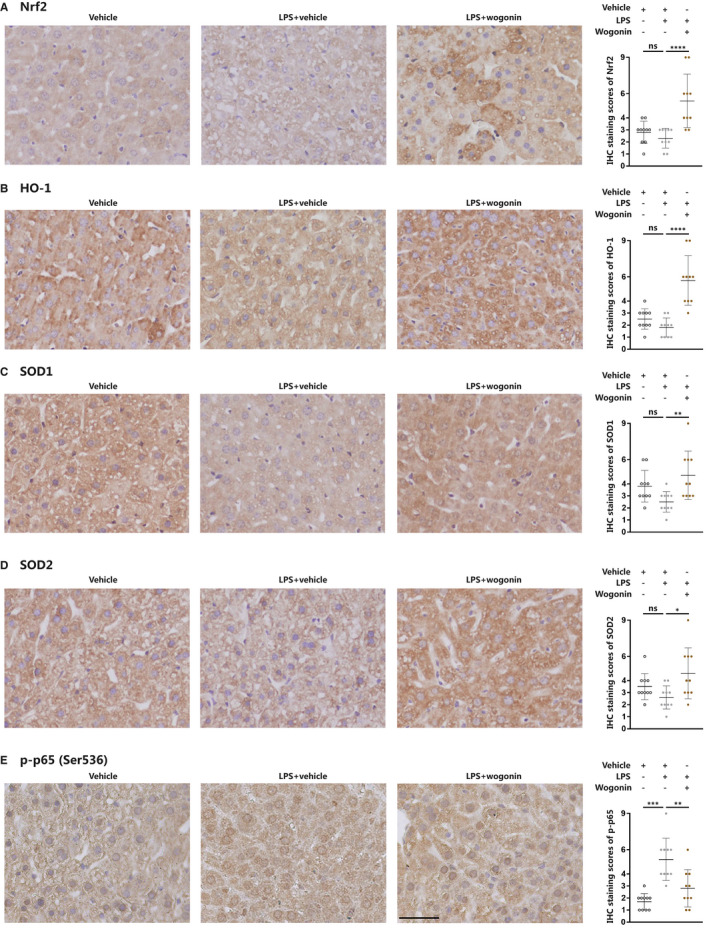
FIGURE 6.

Wogonin activates Nrf2 signalling in liver tissue of LPS‐induced sepsis mice. A‐E, Representative IHC images and IHC score analysis of Nrf2, HO‐1, SOD1, SOD2 and p‐p65 (Ser536) in liver tissue from LPS‐induced septic mice (n = 5). The number of scored fields = 10. Magnification, 400×. Scale bar = 50 μm. The concentration of wogonin was 50.0 mg/kg. The results are presented as mean ± SD through at least 3 independent experiments and were analysed by one‐way analysis of variance (ANOVA). ns, no statistical significance, *P < .05, **P < .01, ***P < .001
