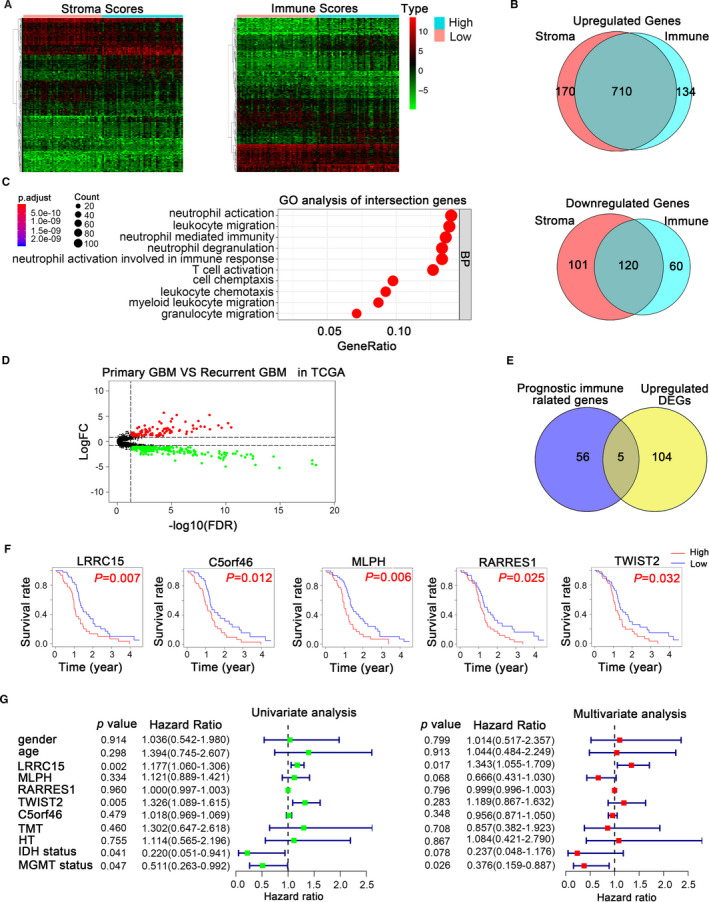
FIGURE 2.

Prognostic immune‐associated genes of recurrent glioblastoma from TCGA database. (A) Heatmap of differential gene profiles (Top 100) based on immune scores and stroma scores. P < 0.05, fold change >1. (B) Venn diagrams showing the number of up‐regulated or down‐regulated interaction genes in immune score groups and stroma score groups. (C) GO analysis of interaction genes. GO, Gene Ontology; BP, Biological process (D) Volcanic plot visualizing the DEGs between primary and recurrent glioblastoma. DEGs, differentially expressed genes. P < 0.05, fold change >1. (E) Venn diagrams showing the prognostic interaction genes between up‐regulated immune‐associated genes and DEGs. (F) Kaplan‐Meier survival curves for the association of the five genes expression with OS in rGBM patients. P < 0.05 in log‐rank tests. (G) Univariate and multivariate Cox regression analysis explored the correlation between the gender, age, LRRC15, MLPH, RARRES1, TWIST2, C5orf46, TMT, HT, IDH status, and MGMT protomer status, and the OS. TMT, targeted molecular therapy; HT, hormone therapy; MGMT, methylation status of the O6‐methylguanine‐DNA methyl‐transferase (MGMT); OS, overall survival
