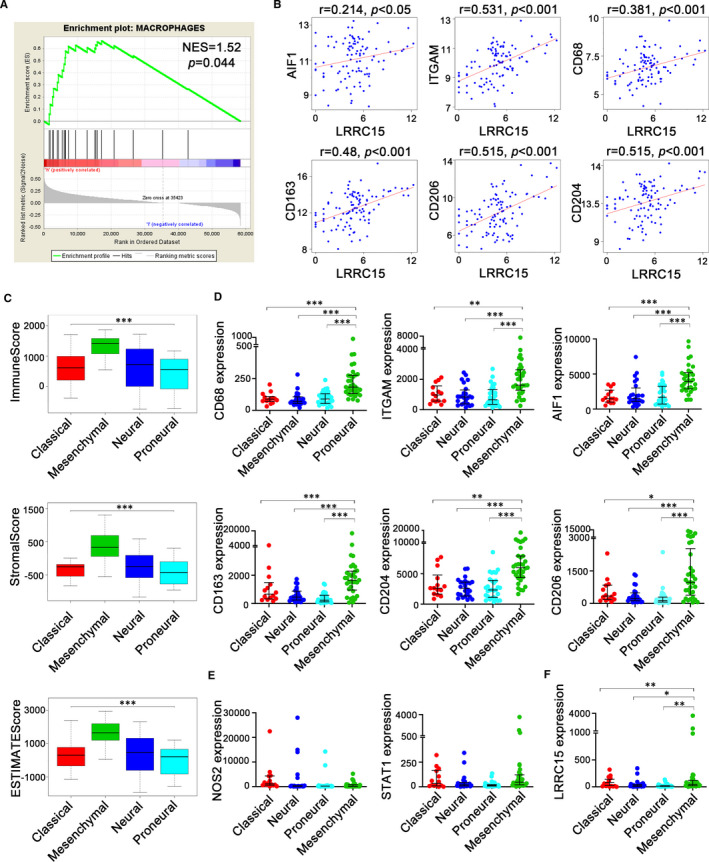
FIGURE 3.

Association and transcriptional subtypes heterogeneity between LRRC15 expression and GAMs. (A) Positive correlation between LRRC15 and macrophages representative gene. Twenty‐two genes were selected as macrophages representative genes for the gene set enrichment 26 NES, normalized enrichment score; FWER P‐val, family‐wise error rate P‐value. (B) Correlation of LRRC15 and respective markers of microglia/macrophages from TCGA RNA‐seq data. (C) Differences of tumour purity among subtypes were shown with distribution of immune scores, stromal scores and estimate scores. (D, E) Expression of phenotypic surface markers of microglia/macrophages in subtypes. (F) LRRC15 expression levels in the mesenchymal GBM subtype were higher than other GBM subtypes. The gene expression level was defined as RSEM (RNA‐seq by expectation‐maximization), and the patient's information was culled from TCGA RNA‐seq datasets (n = 101). Significant differences are indicated by asterisks per the ANOVA with the Holm test, with bars indicating SD (*P < 0.05, **P < 0.01, ***P < 0.001)
