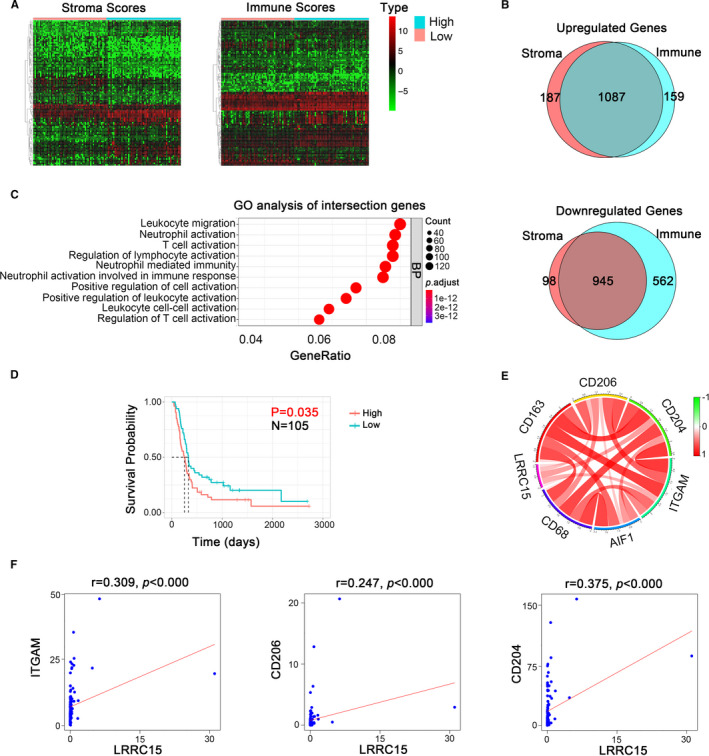
FIGURE 4.

Validation of immune association of LRRC15 in the CGGA data set. (A) Heatmap of differential gene profiles (Top 50) based on immune scores and stroma scores. P <0.05, fold change >1, including LRRC15. (B) Venn diagrams showing the number of up‐regulated or down‐regulated interaction genes in immune score groups and stroma score groups. (C) GO analysis of interaction genes. GO, Gene Ontology. BP, Biological process (D) Kaplan‐Meier survival curves for the association of LRRC15 expression with overall survival (OS) in rGBM patients. P < 0.05 in log‐rank tests. (E‐F) Validation of correlation of LRRC15 and respective markers of microglia/macrophages from CGGA RNA‐seq data
