Abstract
Rectal cancer is a common malignant tumour and the progression is highly affected by the tumour microenvironment (TME). This study intended to assess the relationship between TME and prognosis, and explore prognostic genes of rectal cancer. The gene expression profile of rectal cancer was obtained from TCGA and immune/stromal scores were calculated by Estimation of Stromal and Immune cells in Malignant Tumors using Expression data (ESTIMATE) algorithm. The correlation between immune/stromal scores and survival time as well as clinical characteristics were evaluated. Differentially expressed genes (DEGs) were identified according to the stromal/immune scores, and the functional enrichment analyses were conducted to explore functions and pathways of DEGs. The survival analyses were conducted to clarify the DEGs with prognostic value, and the protein‐protein interaction (PPI) network was performed to explore the interrelation of prognostic DEGs. Finally, we validated prognostic DEGs using data from the Gene Expression Omnibus (GEO) database by PrognoScan, and we verified these genes at the protein levels using the Human Protein Atlas (HPA) databases. We downloaded gene expression profiles of 83 rectal cancer patients from The Cancer Genome Atlas (TCGA) database. The Kaplan‐Meier plot demonstrated that low‐immune score was associated with worse clinical outcome (P = .034), metastasis (M1 vs. M0, P = .031) and lymphatic invasion (+ vs. ‐, P < .001). A total of 540 genes were screened as DEGs with 539 up‐regulated genes and 1 down‐regulated gene. In addition, 60 DEGs were identified associated with overall survival. Functional enrichment analyses and PPI networks showed that the DEGs are mainly participated in immune process, and cytokine‐cytokine receptor interaction. Finally, 19 prognostic genes were verified by GSE17536 and GSE17537 from GEO, and five genes (ADAM23, ARHGAP20, ICOS, IRF4, MMRN1) were significantly different in tumour tissues compared with normal tissues at the protein level. In summary, our study demonstrated the associations between TME and prognosis as well as clinical characteristics of rectal cancer. Moreover, we explored and verified microenvironment‐related genes, which may be the potential key prognostic genes of rectal cancer. Further clinical samples and functional studies are needed to validate this finding.
Keywords: ESTIMATE algorithm, overall survival, prognosis, rectal cancer, tumour microenvironment
1. INTRODUCTION
Rectal cancer is a common malignant tumour of gastrointestinal tract which occurs in the lower part of the colon. Rectal cancer and colon cancer are often grouped as ‘colorectal cancer’(CRC), which is the third leading cause of cancer‐related deaths in the world. There were 1.4 million new CRC cases every year, and this figure will rise in the future. It is expected to increase to 2.2 million CRC cases and 1.1 million deaths in ten years, 1 of which 35% were rectal cancer. 2 In China, the rate of rectal cancer was 11.45 and 8.28 per 100,000 in men and females, respectively. 3 Over the past 30 years, effective screening measures and multimodal therapies had depressed the incidence and mortality rate and improved long‐term survival rates. However, there were 80% of CRC patients show recurrence in the first 3 years. Thus, identifying reliable prognostic biomarkers to select rectal cancer patients at high risk for recurrence is important for improving the survival rate.
TME consists of tumour cells, stromal cells, immune cells and extracellular matrix, which influences cancer growth and development significantly. Tumour cells in the TME can invade tissues directly or through blood and lymphatic vessels, and the infiltrated cells can induce the immune response by releasing cytokines, cytokine receptors and other factors, which influenced the progression of tumour. 4 In recent years, new studies revealed that TME significantly affect the progression of tumours, and have shown a potential predictive value for cancer prognosis, 5 , 6 , 7 , 8 , 9 , 10 , 11 including CRC. 5 , 12
With the rapid development of precision medicine, researchers are increasingly exploring new diagnosis and the treatment targets using statistical algorithms. TCGA provided genomic profiles and clinical information, making it possible to investigate the correlation between genomic features and clinical as well as prognostic characteristics. 13 ESTIMATE is an algorithm which was raised to evaluate the role of stromal and immune cells in cancer biology. ESTIMATE algorithm is a tool assessing stromal score, immune score and estimate score (that infers tumour purity) in tumour tissues by using gene expression data.
TCGA database and the ESTIMATE algorithm has been widely applied to investigate cancer prognosis prediction. Recent studies showed ESTIMATE has good precision in hepatocellular carcinoma, renal cell carcinoma and glioblastoma, 14 , 15 , 16 , 17 , 18 but it has not been applied for rectal cancer. Therefore, we intend to identify TME‐related genes that significantly affect rectal cancer prognosis by ESTIMATE and TCGA database.
2. METHODS
2.1. Data source
We downloaded gene expression profile and survival information as well as clinical features of rectal cancer patients from TCGA database (https://tcga‐data.nci.nih.gov/tcga). The clinical features include age, gender, race, TNM status, survival status, values of carcinoembryonic antigen (CEA), venous invasion, lymphatic invasion and perineural invasion condition. We downloaded all the data from TCGA, and performed data acquirement and application following TCGA guidelines.
2.2. Survival analysis and DEGs identification
To explore the correlation between stromal or immune scores and prognosis of rectal cancer patients, we performed survival analysis with survival time. Immune and stromal scores were calculated by ESTIMATE algorithm, and categorized into high‐ and low‐score group according to the median of immune/stromal scores. We performed the analyses using R package ‘limma’ (version 3.44.1), with the following cut‐off value: log fold change (FC) > 1.0 and false discovery rate (FDR) <0.05. Heatmaps were performed using R package ‘pheatmap’ (version 1.12.0) package. To identify the predictive DEGs in overall survival (OS) of rectal cancer, we constructed Kaplan‐Meier plots.
2.3. Functional enrichment analyses
Gene Ontology (GO) and Kyoto Encyclopedia of Genes and Genomes (KEGG) enrichment analysis was performed to reveal the functions and associated pathways of DEGs, with ‘cluster profile’ (version 3.17.0), ‘org. Hs.eg.db’ (version 3.11.1), ‘enrichplot’ (version 1.8.1) and ‘ggplot2’ (version 3.3.0) on R.
2.4. PPI network construction
To understand the interactions between prognostic DEGs, we constructed the PPI network by an opensource software platform Search Tool for the Retrieval of Interacting Genes (STRING, https://string‐db.org/). Then the modular analysis was performed by CytoHubba plug‐in in the Cytoscape software (version 3.7.1), and the most significant modules were identified based on the score and node number.
2.5. Verification of DEGs using GEO database and clinical tissue samples
To verify the prognostic DEGs from TCGA, we downloaded the gene expression and prognostic data from GSE17536 and GSE17537 data sets using PrognoScan online tool. 19 To further confirm the reliability of the prognostic DEGs, we detected the antibody‐based protein expression data in normal tissues and tumour tissues from The Human Protein Atlas database (HPA, www.proteinatlas.org.).
2.6. Expression of hub genes in cell types
The Single Cell Type Atlas part in HPA showed the expression of protein‐coding genes in single human cell types, and the number of genes detected in cell types. The mRNA and protein levels of hub genes expression in cell types were evaluated using this tool.
2.7. Statistical analysis
The Kaplan‐Meier survival analyses was used to illuminate correlations between expression of DEGs and the OS of rectal cancer, and identify prognostic DEGs in overall survival. Univariate analyses were performed between clinical characteristics and stromal/immune scores. All statistical tests were done with R (version 3.6.2). P < .05 was regarded as statistically significant.
3. RESULTS
3.1. Stromal and Immune Scores of the Patients
The gene expression profiles and clinical information of 83 rectal cancer patients were downloaded from TCGA database. Based on the ESTIMATE algorithm, stromal score ranges from −1979.57 to 1,522.96, and immune score ranges from −656.67 to 2,102.23 (Table 1).
TABLE 1.
Immune scores, stromal scores and clinical characteristics of patients with rectal cancer
| Characteristic | No. | Percent (%) | Stromal score range | Immune score range |
|---|---|---|---|---|
| Age | ||||
| >60 | 52 | 62.65 | ‐1979.57 to 1522.96 | ‐627.18 to 2102.23 |
| ≤60 | 31 | 37.35 | ‐1647.38 to 437.50 | ‐656.67 to 1634.65 |
| Gender | ||||
| Male | 47 | 56.63 | ‐1831.95 to 736.53 | ‐656.67 to 1634.65 |
| Female | 36 | 43.37 | ‐1979.57 to 1522.96 | ‐627.18 to 2102.23 |
| TNM Stage | ||||
| I | 17 | 20.48 | ‐1500.59 to 710.82 | ‐656.67 to 1333.14 |
| II | 25 | 30.12 | ‐1440.11 to 353.92 | ‐477.23 to 1215.29 |
| III | 23 | 27.71 | ‐1979.57 to 1522.96 | ‐627.18 to 2102.23 |
| IV | 13 | 15.66 | ‐1831.95 to 736.53 | ‐650.76 to 1365.69 |
| Unknown | 4 | 4.82 | ‐1750.89 to −256.74 | ‐239.09 to 169.38 |
| T stage | ||||
| T1 | 4 | 4.82 | ‐1500.59 to −727.389 | ‐262.74 to 1308.84 |
| T2 | 17 | 20.48 | ‐1979.57 to 710.82 | ‐656.67 to 1333.14 |
| T3 | 56 | 67.47 | ‐1831.95 to 1522.96 | ‐650.76 to 2102.23 |
| T4 | 5 | 6.02 | ‐1167.63 to −242.44 | ‐627.18 to 1215.29 |
| N stage | ||||
| N0 | 44 | 53.01 | ‐1750.89 to 710.82 | ‐656.67 to 1333.14 |
| N1 | 25 | 30.12 | ‐1979.57 to 736.52 | ‐627.18 to 1634.65 |
| N2 | 12 | 14.46 | ‐1415.65 to 1522.96 | ‐650.76 to 2102.23 |
| Nx | 1 | 1.20 | ‐256.74 to −256.74 | 121. 05 to 121.42 |
| M stage | ||||
| M0 | 63 | 75.90 | ‐1879.57 to 1622.96 | ‐556.67 to 2202.23 |
| M1 | 13 | 15.66 | ‐1931.95 to 636.53 | ‐750.76 to 1265.69 |
| Mx | 5 | 6.02 | ‐1750.89 to 119.47 | 77.57 to 1215.29 |
| Unknown | 1 | 1.20 | ‐53.40 to −53.40 | 1196.84 to 1196.84 |
| Survival status | ||||
| Death | 72 | 86.75 | ‐1750.89 to 1522.96 | ‐656.67 to 2102.23 |
| Alive | 10 | 12.05 | ‐1979.57 to 24.80 | ‐627.18 to 557.27 |
| CEA | ||||
| ≤5 | 32 | 38.55 | ‐1647.38 to 1522.96 | ‐267.87 to 2102.23 |
| >5 | 19 | 22.89 | ‐1750.89 to 736.53 | ‐477.23 to 1634.65 |
| Unknown | 31 | 37.35 | ‐1979.57 to 450.95 | ‐656.67 to 1308.84 |
| Race | ||||
| White | 37 | 44.58 | ‐1979.57 to 1522.96 | ‐627.18 to 2102.23 |
| Black | 1 | 1.20 | ‐388.15 to −388.15 | 49.44 to 49.44 |
| Unknown | 44 | 53.01 | ‐1647.38 to 736.53 | ‐656.67 to 1396.93 |
| Venous invasion | ||||
| YES | 20 | 24.10 | ‐1562.90 to 1522.96 | ‐477.23 to 2102.23 |
| No | 46 | 55.42 | ‐1750.89 to 450.95 | ‐650.76 to 1634.65 |
| Unknown | 16 | 19.28 | ‐1979.57 to 736.53 | ‐656.67 to 1365.69 |
| Lymphatic invasion | ||||
| Yes | 32 | 38.55 | ‐1697.38 to 1472.96 | ‐700.76 to 2052.23 |
| No | 37 | 44.58 | ‐1700.89 to 760.82 | ‐577.18 to 1588.38 |
| Unknown | 13 | 15.66 | ‐1979.57 to 736.53 | ‐656.67 to 1365.69 |
| Perineural Invasion | ||||
| Yes | 8 | 9.64 | ‐1750.89 to 710.82 | ‐232.18 to 1634.65 |
| No | 19 | 22.89 | ‐1440.11 to 450.95 | ‐627.18 to 1538.38 |
| Unknown | 55 | 66.27 | ‐1979.57 to 1522.96 | ‐656.67 to 2102.23 |
To explore the association between OS and immune or stromal scores, we classified the 83 rectal cancer patients into high‐ and low‐score groups based on the median of stromal scores (−636.30) and immune scores (268.92). Kaplan‐Meier analysis was performed and the survival curves showed that patients in the high‐immune score group had a better prognosis than those in the low‐immune score group (P = .034, Figure 1A). However, there were no statistical differences between high‐stromal score group and low‐stromal score group (P = .316, Figure 1B).
FIGURE 1.
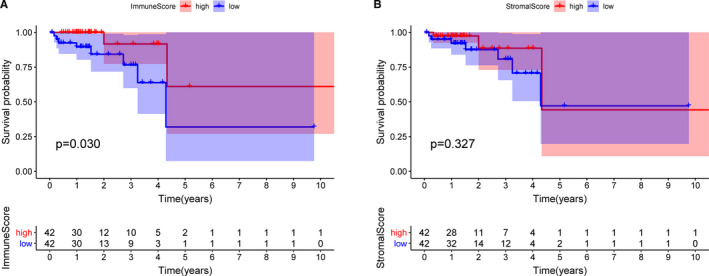
Overall survival curves obtained by the Kaplan‐Meier method describing the correlation between immune scores or stromal scores and prognosis of patients. A, Immune score was significantly associated with overall survival (P = .034). B, There was no significantly correlation between stromal score and overall survival (P = .316). Horizontal and vertical axes represent survival times and survival rates, respectively. Red and blue curves represent high and low score group, respectively
In addition, we analysed the relationship between immune or stromal scores and clinical characteristics. We found that low‐immune score was associated with M1 (vs. M0, P = .031, Figure 2A), and lymphatic invasion (+ vs. ‐, P < .001, Figure 2B), indicating that lower immune scores indicated the advanced rectal cancer stage. However, there were no evidence to support significant correlation between stromal/ immune scores and T status, N status, CEA value, venous or perineural invasion. (Figure S1, P >.05).
FIGURE 2.
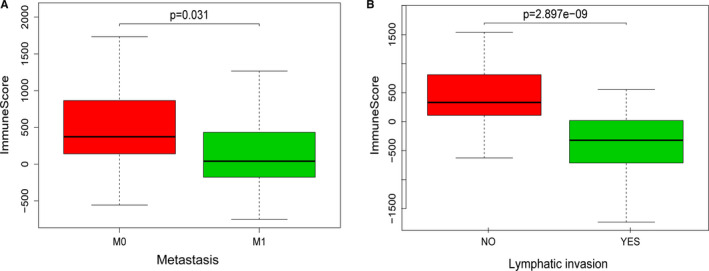
The relationship between immune score and clinical characteristics of patients. A, Low‐immune score was associated with metastasis (M1 vs. M0, P = .031). B, Low‐immune score was associated with lymphatic invasion (+ vs. ‐, P < .001)
3.2. Identification of DEGs
To determine the DEGs associated with TME of rectal cancer, we analysed and compared the gene expression profiles of cases in high‐ and low‐immune/stromal score groups. For immune scores, 756 up‐regulated genes and 3 down‐regulated genes were identified (Figure 3A). Similarly, for stromal scores, 1144 up‐regulated genes and 17 down‐regulated genes were identified (Figure 3B). Then, we analysed the shared up‐regulated and down‐regulated genes in immune and stromal score groups, with 539 up‐regulated and 1 down‐regulated gene identified which is shown in Venn diagrams (Figure 4). Totally, there were 540 genes were screened as DEGs.
FIGURE 3.
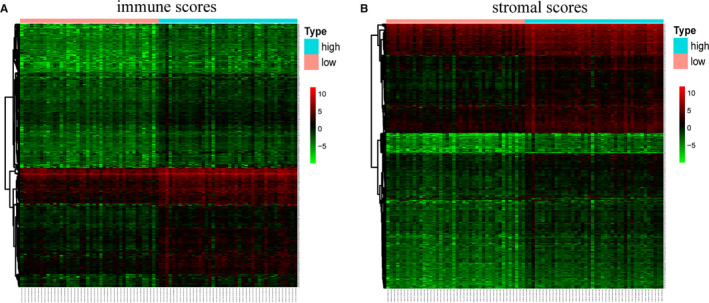
Heatmap of DEGs between high and low groups in immune scores and stromal scores. A, Immune scores (low score in left and high score in right); B, Stromal scores (low score in left and high score in right)
FIGURE 4.
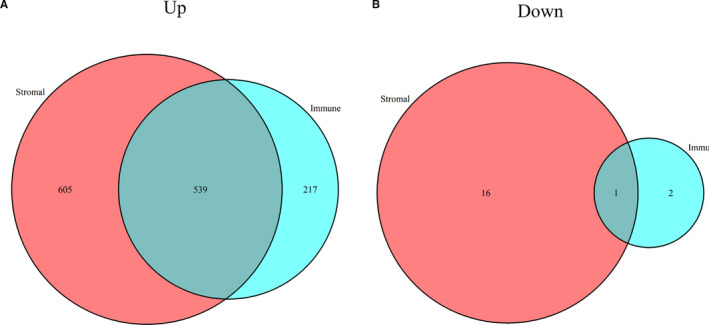
Common up‐regulated or down‐regulated DEGs in immune scores and stromal scores. A, 539 common up‐regulated genes in immune scores and stromal scores; B, 1 common down‐regulated gene in immune scores and stromal scores
3.3. GO function and KEGG pathway enrichment analyses
The GO function analyses consisted of biological processes (BP), cellular component (CC) and molecular function (MF). For BP, DEGs were mainly enriched in the T cell and lymphocyte activation, leukocyte migration, proliferation and cell‐cell adhesion. For CC, DEGs mainly clustered in the plasma membrane, granule and granule membrane, collagen‐containing extracellular matrix and endocytic vesicle. For MF, DEGs mainly concentrate on receptor ligand activity, receptor binding, cytokine activity and chemokine activity. (Figure 5A). The KEGG analysis indicated that these DEGs were enriched in cytokine‐cytokine receptor interaction and chemokine signalling pathways. (Figure 5B).
FIGURE 5.
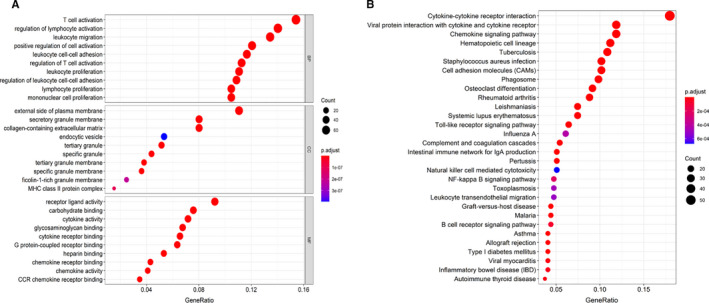
GO functional enrichment analyses and KEGG pathway analyses of DEGs. A, The top 30 significantly enriched GO terms, including biological process (BP), molecular function (MF) and cellular component (CC). B, KEGG pathway analyses of DEGs
3.4. Survival analysis of the DEGs
To explore the prognostic value of 540 DEGs, we performed the Kaplan‐Meier survival analysis. Among the 540 DEGs, a total of 60 DEGs (P < .05, Table S1) were significantly associated with OS (Figure 6), and all the genes were up‐regulated DEGs.
FIGURE 6.
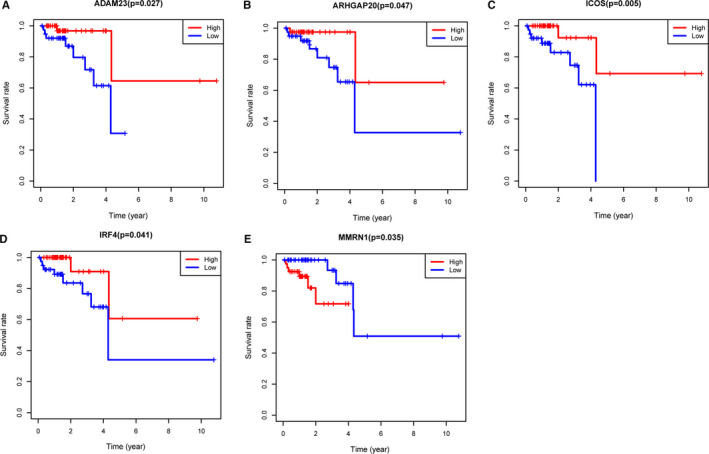
Five TCGA genes were verified to be related to OS
3.5. Module analysis from the PPI network
To further explore the interaction of the prognostic DEGs and the mechanisms underlying the rectal cancer development, we utilized the STRING online database and Cytoscape software to analyse these DEGs and construct a PPI network, which contains 40 nodes and 166 edges (Figure 7A). We then carried out clustering analysis and identified nine function modules. The top three significant modules were selected based on the degree of importance and the biological processes were analysed associated with the genes in the three modules.
FIGURE 7.
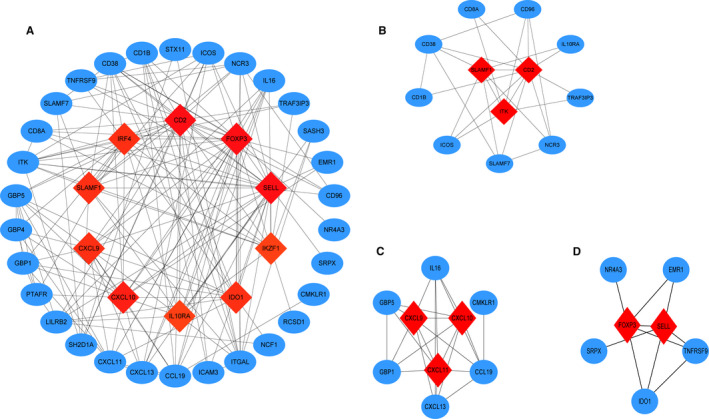
PPI network of prognostic DEGs and the top three significant modules. A, PPI network of the DEGs. B, PPI network of the 12 prognostic DEGs in Module 1. C, PPI network of the 9 prognostic DEGs in Module 2. D, PPI network of the 7 prognostic DEGs in Module 3
Module 1 contains 12 nodes and 26 edges (Figure 7B). GO analysis revealed the 12 genes to be mainly enriched in the immune system process; KEGG pathway enrichment analyses demonstrated that the 12 genes are associated with haematopoietic cell lineage, T cell receptor signalling pathway and cell adhesion molecules. Module 2 contains 9 nodes and 23 edges (Figure 7C); GO and KEGG analysis indicates these 9 genes mainly enriched in chemokine signalling pathway and cytokine‐cytokine receptor interaction. Module 3 contains 7 nodes and 10 edges (Figure 7D), GO and KEGG analysis showed these 9 genes are associated with regulation of chronic inflammatory response and immune system process.
3.6. Validation of prognostic DEGs using the GEO database
To verify the DEGs from TCGA database, we downloaded the gene expression and prognostic information from the GSE17536 and GSE17537 data sets using PrognoScan online tool. A total of 19 prognostic genes were verified, which may have potential value for diagnosis and treatment of rectum cancer (Figure 8).
FIGURE 8.
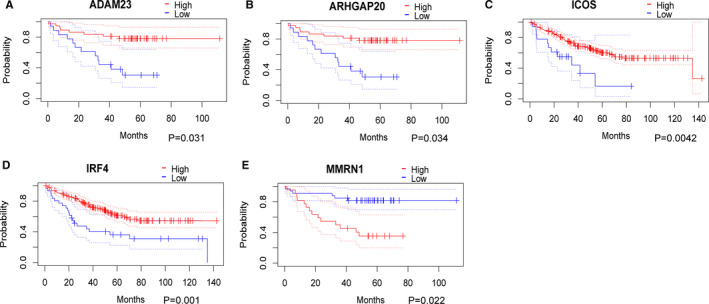
Validation of prognostic genes using data from the GEO database
3.7. Verification of Prognostic DEGs using clinical tissue samples
To verify the reliability of the DEGs with prognostic values, we detected the protein expression of 19 genes in normal tissues and tumour tissues by HPA. The results showed that 5 proteins (ADAM23, ARHGAP20, ICOS, IRF4, MMRN1) were significantly different in tumour tissues compared with normal tissues (Figure 9).
FIGURE 9.
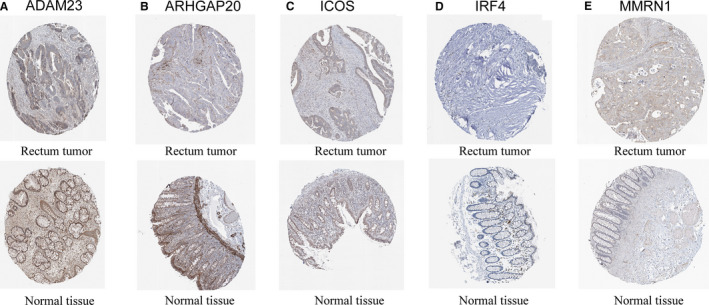
IHC analysis of genes with prognostic values
3.8. Expression of hub genes in cell types
The mRNA and protein levels of the 5 hub genes expression in cell types were evaluated, and the results showed that expression was predominantly found in blood and immune cells, mesenchymal cells, endocrine and germ cells cell types (Figure 10). Flow diagram of this study was listed in Figure S2.
FIGURE 10.
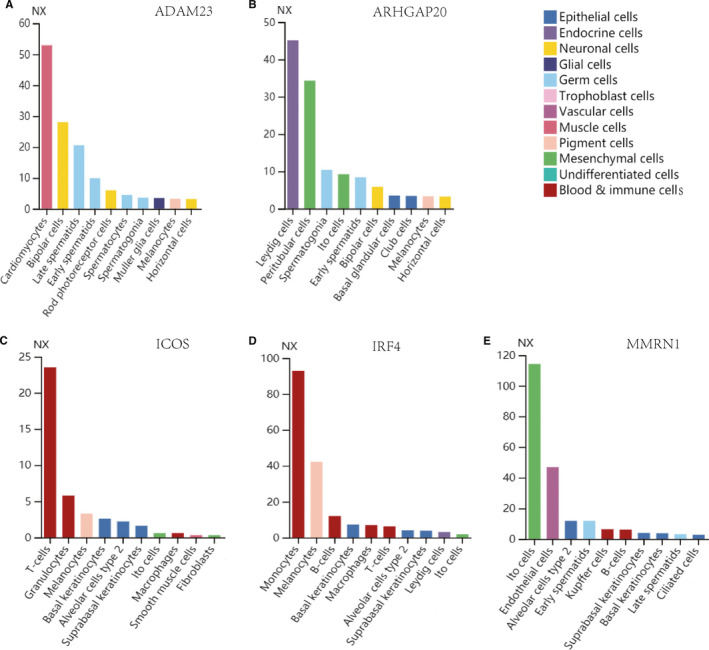
The expression of hub genes in cell types
4. DISCUSSION
In this study, we explored the level of stromal/immune cells and the relation between stromal/immune cells and overall survival of rectal cancer by the ESTIMATE algorithm and TCGA database. Moreover, we screened 540 tumour microenvironment‐related genes and explored prognostic biomarkers. Then we performed functional enrichment analysis and constructed the PPI network for exploring the potential mechanism of rectal cancer. The results showed that high‐immune score predicted a better prognosis in rectal cancer patients according to Kaplan‐Meier. In addition, a total of 60 DEGs were determined to be related with OS. Furthermore, GO and KEGG analyses revealed that DEGs are mainly enriched in the immune response, cytokine and chemokine activity. Finally, a total of 5 DEGs were verified GEO database and clinical tissue samples.
Tumour development is highly dependent on TME, which is consisted of extracellular matrix, stromal cells and immune cells, and any alterations of TME may influence the growth and progression of malignancies. 20 However, current studies have not effectively analysed the components of TME of rectal cancer. ESTIMATE algorithm is a biology tool that based on expression signatures and Gene Set Enrichment Analysis to explore the stromal and immune cells in tumour samples. 14 ESTIMATE has been successfully used in TME to determine immune/stromal cell consistence and their relations to clinical outcome in lung cancer, 21 , 22 breast cancer, 23 ovarian cancer, 24 renal cell carcinoma, 25 , 26 adrenocortical carcinoma, 27 cutaneous melanoma, 28 bladder cancer, 29 endometrial cancer, 30 pancreatic adenocarcinoma 31 and osteosarcoma. 32 It is the first study to evaluate the immune/stromal infiltration and their relations to prognosis and clinical outcomes in rectal cancer.
Firstly, we found patients with high‐immune score had a better OS, which may due to the positive correlation between the higher immune score and less tumour cell. In addition, the lower immune score was significantly related to the M1 stage and lymphatic invasion, indicating that lower immune scores indicated the advanced cancer stage and worse prognosis. These results were similar to previous studies, which have demonstrated that lower immune scores were significantly associated with poor overall survival in adrenocortical carcinoma, 27 osteosarcoma 32 and gastric cancer. 33 However, some studies found that a higher immune score indicated a worse OS in clear cell renal cell cancer, 16 , 17 , 25 and acute myeloid leukaemia. 34 The underlying mechanism was not clear and required more explorations.
Then, we analysed the gene expression profiles and identified 540 DEGs and performed functional enrichment analysis. The GO functional analysis suggested that these DEGs were mainly involved in immune response, cytokine and chemokine activity. The KEGG pathway enrichment analysis showed that DEGs mainly clustered in cytokine‐cytokine receptor interaction and chemokine signalling pathway. These signalling immune cells and chemokines take an important role in the microenvironment and the progression of tumours. Chemokines were mediators of inflammation (inflammatory chemokines), which plays a key role in the progression of cancers, 35 including the recruitment of different types of cell to the TME. Chemokines bind to the chemokine receptor subfamily, including 10 C‐C chemokine receptor (CCR) family members, 7 CXCR family members and CX3CR1.
Furthermore, we identified 60 prognostic genes by performing survival analysis of the 540 DEGs. The module analyses and function analyses showed these DEGs were mainly enriched in immune response, cytokine and chemokine activity. Then, we verified 5 hub genes as key prognostic biomarkers for rectal cancer. Among these genes, the higher expressions of ADAM23, ARHGAP20, ICOS and IRF4 predicted better prognosis, while MMRN1 predicted worse prognosis.
A disintegrin and metalloprotease 23 (ADAM23), a member of the ADAM family, is considered a possible tumour suppressor gene, 36 and is frequently down‐regulated in various types of malignancies. 37 , 38 The silencing or decreased methylation of ADAM23 gene often associated with advanced disease and metastasis in different types of tumours, 39 , 40 including colorectal cancer. 41 ARHGAP family genes are cancer‐associated genes, 42 and the genetic alterations of ARHGAP family genes lead to carcinogenesis. 43 Previous studies showed the methylation of ARHGAP20 is associated with prostate cancer, 44 but the relation with gastrointestinal tumours is not clear. Inducible T‐cell co‐stimulator (ICOS) belongs to the B7‐CD28 immunoglobulin superfamily, which has dual role in different malignancies, 45 and might participate in anti‐tumour T cell response as well as a pro‐tumour response. 46 A significant down‐regulation of ICOS can be seen in colon cancer patients, 47 especially in patients with either lymphatic or distant metastasis. Conclusively, expression of ICOS is associated with improved survival in colorectal cancer. 48 Interferon regulatory factor 4 (IRF4), a member of the interferon regulatory factor family of transcription factors, is expressed in cells of the immune system. IRF4 have critical roles in the immunosuppressive tumour microenvironment, 49 and the deficiency of IRF4 accelerates tumour growth and reduces survival in pancreatic cancer. 50 Studies demonstrated that IRF4 was associated with rectal cancer. 51 Multimerin1 (MMRN1) is a di‐sulphide linked homo‐polymeric glycoprotein from EMILIN family. Altered expression of MMRN1 has been reported in hepatocellular carcinoma, cervical cancer and ovarian cancer. 52 , 53 MMRN1 also played an important risk factor in gastric cancer microenvironment. 54 But its role in rectal cancer is not clear.
Our findings have certain clinical implications. Firstly, the expression level of DEGs in rectal tumour tissue may contribute to the prognosis prediction and the evaluation of survival. For example, patients with a high expression of protective genes may have good prognosis and longer survival. Secondly, the DEGs could help guide personalized treatment. For patients with a high expression of risk genes, it is worthwhile to perform detailed examinations and aggressive treatments to prevent tumour metastasis and lymphatic invasion. Thirdly, these genes have functional relevance in rectal cancer, which could contribute to the search for biomarkers and therapeutic targets. Besides, these genes are promising biomarkers in rectal cancer because of highly stability and non‐invasive biopsy.
There are some limitations in this study. Firstly, the selection bias could not be excluded because all data were gathered from TCGA and GEO databases. Secondly, there was no experimental research to examine the functions of DEGs. Thus, further validation is needed to testify the discovery of this research.
In summary, we found that stromal and immune scores were highly associated with the clinical outcome of rectal cancer by ESTIMATE algorithm and TCGA database. In addition, we identified 5 microenvironment‐related genes which could be useful for outlining the prognosis of rectal cancer. The results could contribute to the search for rectal cancer biomarkers and therapeutic targets.
CONFLICTS OF INTEREST
There are no conflicts of interest.
AUTHOR CONTRIBUTIONS
Chao Li: Data curation (supporting); Formal analysis (supporting); Methodology (supporting); Software (supporting); Writing‐original draft (supporting); Writing‐review & editing (supporting). Tao Liu: Formal analysis (supporting); Writing‐review & editing (supporting). Yi Liu: Software (supporting); Validation (supporting). Jiantao Zhang: Conceptualization (supporting); Project administration (lead). Didi Zuo: Data curation (lead); Formal analysis (lead); Methodology (lead); Software (lead); Writing‐original draft (lead); Writing‐review & editing (lead).
Supporting information
Figure S1
Figure S2
Table S1
Li C, Liu T, Liu Y, Zhang J, Zuo D. Prognostic value of tumour microenvironment‐related genes by TCGA database in rectal cancer. J Cell Mol Med. 2021;25:5811–5822. 10.1111/jcmm.16547
Contributor Information
Jiantao Zhang, Email: zhangjt1980@163.com.
Didi Zuo, Email: zuodidi1991@163.com.
DATA AVAILABILITY STATEMENT
The data that support the findings of this study are available from the corresponding author upon reasonable request.
REFERENCES
- 1. Arnold M, Sierra MS, Laversanne M, et al. Global patterns and trends in colorectal cancer incidence and mortality. Gut. 2017;66(4):683‐691. [DOI] [PubMed] [Google Scholar]
- 2. Glynne‐Jones R, Wyrwicz L, Tiret E, et al. Rectal cancer: ESMO clinical practice guidelines for diagnosis, treatment and follow‐up. Ann Oncol. 2017;28(suppl_4):v22‐v40. [DOI] [PubMed] [Google Scholar]
- 3. Li HL, Gao YT, Zheng Y, et al. Incidence trends of colorectal cancer in urban Shanghai, 1973–2005. Zhonghua Yu Fang Yi Xue Za Zhi. 2009;43(10):875‐879. [PubMed] [Google Scholar]
- 4. Ge P, Wang W, Li L, et al. Profiles of immune cell infiltration and immune‐related genes in the tumor microenvironment of colorectal cancer. Biomed Pharmacother. 2019;118:109228. [DOI] [PubMed] [Google Scholar]
- 5. Xiong Y, Wang K, Zhou H, et al. Profiles of immune infiltration in colorectal cancer and their clinical significant: A gene expression‐based study. Cancer Med. 2018;7(9):4496‐4508. [DOI] [PMC free article] [PubMed] [Google Scholar]
- 6. Liu Z, Zhu Y, Xu L, et al. Tumor stroma‐infiltrating mast cells predict prognosis and adjuvant chemotherapeutic benefits in patients with muscle invasive bladder cancer. Oncoimmunology. 2018;7(9):e1474317. [DOI] [PMC free article] [PubMed] [Google Scholar]
- 7. Zhang S, Zhang E, Long J, et al. Immune infiltration in renal cell carcinoma. Cancer Sci. 2019;110(5):1564‐1572. [DOI] [PMC free article] [PubMed] [Google Scholar]
- 8. Roma‐Rodrigues C, Mendes R, Baptista PV, et al. Targeting tumor microenvironment for cancer therapy. Int J Mol Sci. 2019;20(4):840. [DOI] [PMC free article] [PubMed] [Google Scholar]
- 9. Leman J, Munoz‐Erazo L, Kemp RA. The intestinal tumour microenvironment. Adv Exp Med Biol. 2020;1226:1‐22. [DOI] [PubMed] [Google Scholar]
- 10. Tahmasebi BM, Carloni V. Tumor microenvironment, a paradigm in hepatocellular carcinoma progression and therapy. Int J Mol Sci. 2017;18(2):405. [DOI] [PMC free article] [PubMed] [Google Scholar]
- 11. Wu J, Liang C, Chen M, et al. Association between tumor‐stroma ratio and prognosis in solid tumor patients: a systematic review and meta‐analysis. Oncotarget. 2016;7(42):68954‐68965. [DOI] [PMC free article] [PubMed] [Google Scholar]
- 12. Alonso MH, Ausso S, Lopez‐Doriga A, et al. Comprehensive analysis of copy number aberrations in microsatellite stable colon cancer in view of stromal component. Br J Cancer. 2017;117(3):421‐431. [DOI] [PMC free article] [PubMed] [Google Scholar]
- 13. Lee H, Palm J, Grimes SM, et al. The cancer genome atlas clinical explorer: a web and mobile interface for identifying clinical‐genomic driver associations. Genome Med. 2015;7:112. [DOI] [PMC free article] [PubMed] [Google Scholar]
- 14. Yoshihara K, Shahmoradgoli M, Martinez E, et al. Inferring tumour purity and stromal and immune cell admixture from expression data. Nat Commun. 2013;4:2612. [DOI] [PMC free article] [PubMed] [Google Scholar]
- 15. Deng Z, Wang J, Xu B, et al. Mining TCGA database for tumor microenvironment‐related genes of prognostic value in hepatocellular carcinoma. Biomed Res Int. 2019;2019:2408348. [DOI] [PMC free article] [PubMed] [Google Scholar]
- 16. Chen B, Chen W, Jin J, et al. Data mining of prognostic microenvironment‐related genes in clear cell renal cell carcinoma: a study with TCGA database. Dis Markers. 2019;2019:8901649. [DOI] [PMC free article] [PubMed] [Google Scholar]
- 17. Hu D, Zhou M, Zhu X. Deciphering immune‐associated genes to predict survival in clear cell renal cell cancer. Biomed Res Int. 2019;2019:2506843. [DOI] [PMC free article] [PubMed] [Google Scholar]
- 18. Jia D, Li S, Li D, et al. Mining TCGA database for genes of prognostic value in glioblastoma microenvironment. Aging (Albany NY). 2018;10(4):592‐605. [DOI] [PMC free article] [PubMed] [Google Scholar]
- 19. Mizuno H, Kitada K, Nakai K, et al. PrognoScan: a new database for meta‐analysis of the prognostic value of genes. BMC Med Genomics. 2009;2:18. [DOI] [PMC free article] [PubMed] [Google Scholar]
- 20. Merlano MC, Abbona A, Denaro N, et al. Knowing the tumour microenvironment to optimise immunotherapy. Acta Otorhinolaryngol Ital. 2019;39(1):2‐8. [DOI] [PMC free article] [PubMed] [Google Scholar]
- 21. Li J, Li X, Zhang C, et al. A signature of tumor immune microenvironment genes associated with the prognosis of nonsmall cell lung cancer. Oncol Rep. 2020;43(3):795‐806. [DOI] [PubMed] [Google Scholar]
- 22. Qu Y, Cheng B, Shao N, et al. Prognostic value of immune‐related genes in the tumor microenvironment of lung adenocarcinoma and lung squamous cell carcinoma. Aging (Albany NY). 2020;12:4757–4777. [DOI] [PMC free article] [PubMed] [Google Scholar]
- 23. Xu M, Li Y, Li W, et al. Immune and stroma related genes in breast cancer: a comprehensive analysis of tumor microenvironment based on the cancer genome atlas (TCGA) database. Front Med (Lausanne). 2020;7:64. [DOI] [PMC free article] [PubMed] [Google Scholar]
- 24. Ding Q, Dong S, Wang R, et al. A nine‐gene signature related to tumor microenvironment predicts overall survival with ovarian cancer. Aging (Albany NY). 2020;12:4879–4895. [DOI] [PMC free article] [PubMed] [Google Scholar]
- 25. Wan B, Liu B, Huang Y, et al. Identification of genes of prognostic value in the ccRCC microenvironment from TCGA database. Mol Genet Genomic Med. 2020:8;e1159. [DOI] [PMC free article] [PubMed] [Google Scholar]
- 26. Zeng Q, Zhang W, Li X, et al. Bioinformatic identification of renal cell carcinoma microenvironment‐associated biomarkers with therapeutic and prognostic value. Life Sci. 2020;243:117273. [DOI] [PubMed] [Google Scholar]
- 27. Li X, Gao Y, Xu Z, et al. Identification of prognostic genes in adrenocortical carcinoma microenvironment based on bioinformatic methods. Cancer Med. 2020;9(3):1161‐1172. [DOI] [PMC free article] [PubMed] [Google Scholar]
- 28. Yang S, Liu T, Nan H, et al. Comprehensive analysis of prognostic immune‐related genes in the tumor microenvironment of cutaneous melanoma. J Cell Physiol. 2020;235(2):1025‐1035. [DOI] [PubMed] [Google Scholar]
- 29. Zhang Z, Chen D, Li Z, et al. Bioinformatics analysis to screen the key prognostic genes in tumor microenvironment of bladder cancer. Biomed Res Int. 2020;2020:6034670. [DOI] [PMC free article] [PubMed] [Google Scholar]
- 30. Chen P, Yang Y, Zhang Y, et al. Identification of prognostic immune‐related genes in the tumor microenvironment of endometrial cancer. Aging (Albany NY). 2020;12(4):3371‐3387. [DOI] [PMC free article] [PubMed] [Google Scholar]
- 31. Meng Z, Ren D, Zhang K, et al. Using ESTIMATE algorithm to establish an 8‐mRNA signature prognosis prediction system and identify immunocyte infiltration‐related genes in Pancreatic adenocarcinoma. Aging (Albany NY). 2020;12. [DOI] [PMC free article] [PubMed] [Google Scholar]
- 32. Zhang C, Zheng JH, Lin ZH, et al. Profiles of immune cell infiltration and immune‐related genes in the tumor microenvironment of osteosarcoma. Aging (Albany NY). 2020;12(4):3486‐3501. [DOI] [PMC free article] [PubMed] [Google Scholar]
- 33. Wang H, Wu X, Chen Y. Stromal‐immune score‐based gene signature: a prognosis stratification tool in gastric cancer. Front Oncol. 2019;9:1212. [DOI] [PMC free article] [PubMed] [Google Scholar]
- 34. Ni J, Wu Y, Qi F, et al. Screening the cancer genome atlas database for genes of prognostic value in acute myeloid leukemia. Front Oncol. 2019;9:1509. [DOI] [PMC free article] [PubMed] [Google Scholar]
- 35. Lazennec G, Richmond A. Chemokines and chemokine receptors: new insights into cancer‐related inflammation. Trends Mol Med. 2010;16(3):133‐144. [DOI] [PMC free article] [PubMed] [Google Scholar]
- 36. Takada H, Imoto I, Tsuda H, et al. ADAM23, a possible tumor suppressor gene, is frequently silenced in gastric cancers by homozygous deletion or aberrant promoter hypermethylation. Oncogene. 2005;24:8051‐8060. [DOI] [PubMed] [Google Scholar]
- 37. Zmetakova I, Kalinkova L, Smolkova B, et al. A disintegrin and metalloprotease 23 hypermethylation predicts decreased disease‐free survival in low‐risk breast cancer patients. Cancer Sci. 2019;110(5):1695‐1704. [DOI] [PMC free article] [PubMed] [Google Scholar]
- 38. Ota M, Mochizuki S, Shimoda M, et al. ADAM23 is downregulated in side population and suppresses lung metastasis of lung carcinoma cells. Cancer Sci. 2016;107(4):433‐443. [DOI] [PMC free article] [PubMed] [Google Scholar]
- 39. Costa ET, Barnabé GF, Li M, et al. Intratumoral heterogeneity of ADAM23 promotes tumor growth and metastasis through LGI4 and nitric oxide signals. Oncogene. 2015;34(10):1270‐1279. [DOI] [PubMed] [Google Scholar]
- 40. Kalinkova L, Zmetakova I, Smolkova B, et al. Decreased methylation in the SNAI2 and ADAM23 genes associated with de‐differentiation and haematogenous dissemination in breast cancers. BMC Cancer. 2018;18(1):875. [DOI] [PMC free article] [PubMed] [Google Scholar]
- 41. Choi J, Kim K, Jeon Y, et al. Promoter hypermethylation of the ADAM23 gene in colorectal cancer cell lines and cancer tissues. Int J Cancer. 2009;124(6):1258‐1262. [DOI] [PubMed] [Google Scholar]
- 42. Katoh Y, Katoh M. Identification and characterization of ARHGAP27 gene in silico. Int J Mol Med. 2004;14(5):943‐947. [PubMed] [Google Scholar]
- 43. Katoh M, Katoh M. Characterization of human ARHGAP10 gene in silico. Int J Oncol. 2004;25(4):1201‐1206. [PubMed] [Google Scholar]
- 44. Li D, Xu Z, Liu J, et al. Restriction landmark genomic scanning for screening aberrant CpG methylations in prostate cancer. Nan fang yi ke da xue xue bao. 2016;36(1):103‐108. [PubMed] [Google Scholar]
- 45. Amatore F, Gorvel L, Olive D. Role of Inducible Co‐Stimulator (ICOS) in cancer immunotherapy. Expert opinion on biological therapy. 2020;20(2):141‐150. [DOI] [PubMed] [Google Scholar]
- 46. Amatore F, Gorvel L, Olive D. Inducible Co‐Stimulator (ICOS) as a potential therapeutic target for anti‐cancer therapy. Expert opinion on therapeutic targets. 2018;22(4):343‐351. [DOI] [PubMed] [Google Scholar]
- 47. Lee H, Kim JH, Yang SY, et al. Peripheral blood gene expression of B7 and CD28 family members associated with tumor progression and microscopic lymphovascular invasion in colon cancer patients. J Cancer Res Clin Oncol. 2010;136(9):1445‐1452. [DOI] [PubMed] [Google Scholar]
- 48. Zhang Y, Luo Y, Qin S, et al. The clinical impact of ICOS signal in colorectal cancer patients. Oncoimmunology. 2016;5(5):e1141857. [DOI] [PMC free article] [PubMed] [Google Scholar]
- 49. Alvisi G, Brummelman J, Puccio S, et al. IRF4 instructs effector Treg differentiation and immune suppression in human cancer. J Clin Investig. 2020;130(6):3137‐3150. [DOI] [PMC free article] [PubMed] [Google Scholar]
- 50. Metzger P, Kirchleitner SV, Boehmer DFR, et al. Systemic but not MDSC‐specific IRF4 deficiency promotes an immunosuppressed tumor microenvironment in a murine pancreatic cancer model. Cancer Immunol Immunother. 2020;69(10):2101‐2112. [DOI] [PMC free article] [PubMed] [Google Scholar]
- 51. Slattery ML, Lundgreen A, Bondurant KL, et al. Interferon‐signaling pathway: associations with colon and rectal cancer risk and subsequent survival. Carcinogenisis. 2011;32:1660‐1667. [DOI] [PMC free article] [PubMed] [Google Scholar]
- 52. Saini A, Chandra KB, Kumar V, et al. Analysis of Multimerin 1 (MMRN1) expression in ovarian cancer. Mol Biol Rep. 2020;47(12):9459‐9468. [DOI] [PubMed] [Google Scholar]
- 53. Keeratichamroen S, Subhasitanont P, Chokchaichamnankit D, et al. Identification of potential cervical cancer serum biomarkers in Thai patients. Oncology letters. 2020;19(6):3815‐3826. [DOI] [PMC free article] [PubMed] [Google Scholar]
- 54. Sun M, Qiu J, Zhai H, et al. Prognostic implications of novel gene signatures in gastric cancer microenvironment. Med Sci Monit. 2020;26:e924604. [DOI] [PMC free article] [PubMed] [Google Scholar]
Associated Data
This section collects any data citations, data availability statements, or supplementary materials included in this article.
Supplementary Materials
Figure S1
Figure S2
Table S1
Data Availability Statement
The data that support the findings of this study are available from the corresponding author upon reasonable request.


