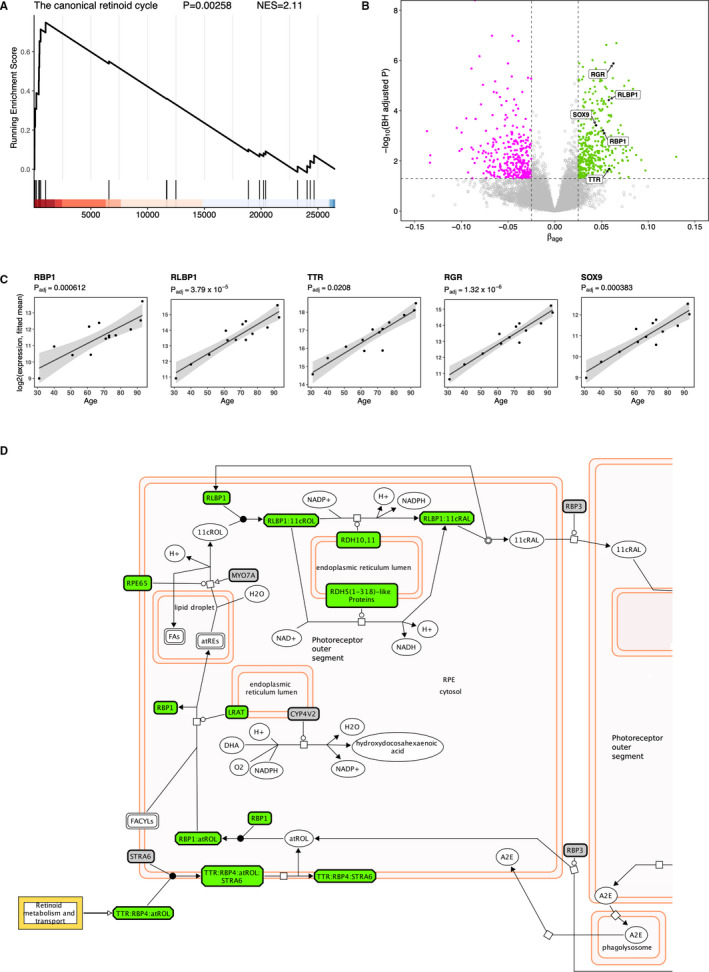
FIGURE 2.

Reactome pathway analysis identifies a further set of visual cycle‐related genes that have increased expression with increasing age. A, GSEA enrichment plot for the canonical retinoid cycle pathway (R‐HSA‐2453902) from the Reactome database. B, Volcano plot showing expression levels of additional visual cycle genes identified from the Reactome pathway (RLBP1, RBP1 and TTR), as well as two other visual cycle genes previously documented (SOX9 and RGR). C, Scatter plots of the expression levels of five additional retinol metabolism genes, from human donors (n = 13) ranging in age from 31 to 93 years. Regression line (black) with 95% confidence interval (grey shading). D, Visual cycle diagram adapted from Reactome pathway browser. 74 Significantly positively correlated genes, and complexes which include a SCG, are highlighted in green. Non‐significant genes are in grey and other compounds which are not proteins are shown in white
