FIGURE 3.

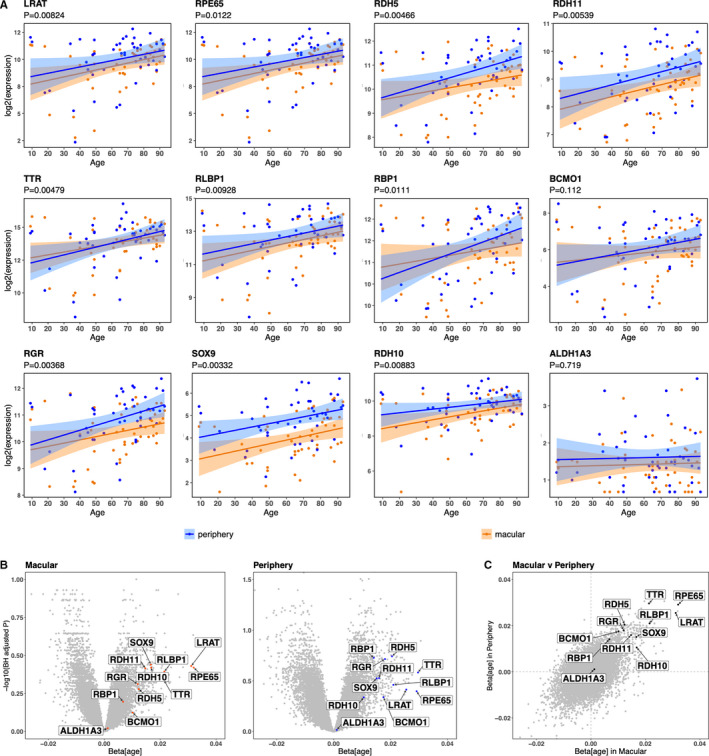
Microarray data from an independent cohort GEO29801 33 confirm that visual cycle genes exhibit increased expression with increasing age in both macular and periphery of the RPE. A, Scatter plots of the 12 previously identified visual cycle genes from donors with no ocular disease and with an age ranging from 9 to 93 years. Showing data from both the macular (in blue; n = 50) and the periphery (in orange; n = 46). To calculate the overall P‐value (H0:βage = 0) combining both macular and periphery data, we implemented a mixed model for each gene. B, Volcano plots for macular and periphery RPE gene expression with respect to age. P values are adjusted for all genes in the genome using the Benjamini‐Hochberg procedure. C, Showing the relationship of the gradient (βage) in the macular versus periphery for the whole RPE transcriptome. Visual cycle genes highlighted in black are all in the upper‐right quadrant, indicative of similar age‐related effect on their transcription in both regions. All data for this figure are selected from the Gene Expression Omnibus dataset GEO29801 33
