
FIGURE 3.
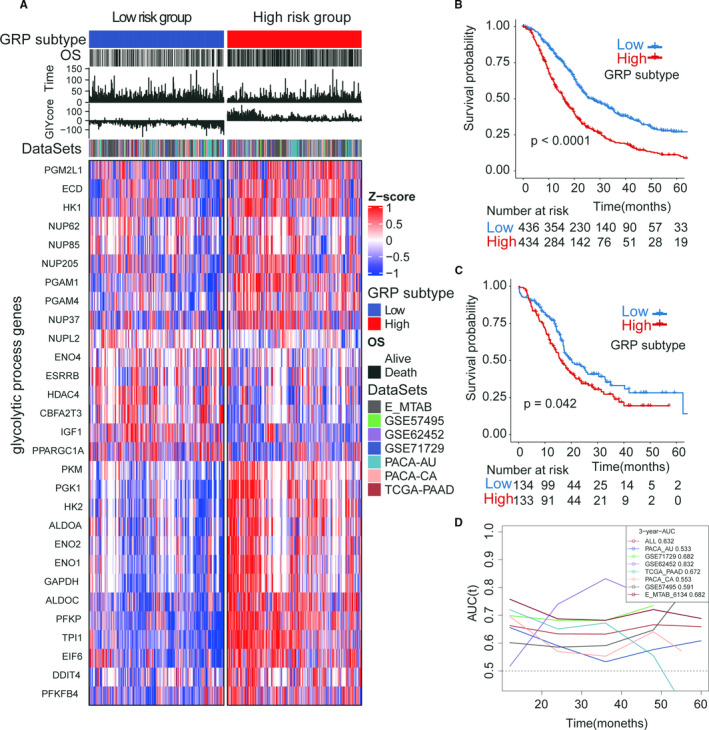
The prognostic value of the GRP score/subtype in the training cohort and validation cohort. (A) heatmap of the 29 prognostic glycolytic genes in the high‐ and low‐GRP subtypes; (B) the Kaplan‐Meier curves of GRP in the training cohort (total patients, n = 1024); (C) the Kaplan‐Meier curves of GRP in the validation cohort (number of patients, n = 267); (D) the time‐dependent ROC of GPR in the training cohort and validation cohort