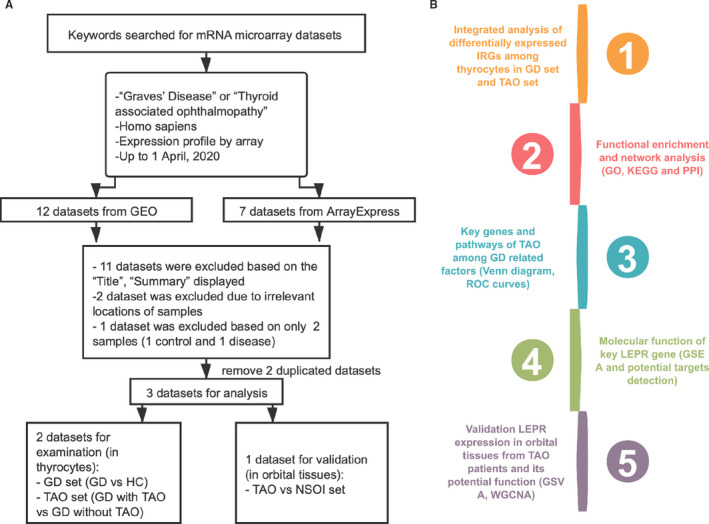
FIGURE 1.

Data set selection flow chart and analysis processes. (A) Totally, 12 data sets from Gene Expression Omnibus (GEO) and 7 data sets from ArrayExpress were evaluated. Finally, 4 data sets for mRNAs were selected for the subsequent analysis. (B) The current study consisted of 5 steps, and the results of analysis were validated in other data sets
