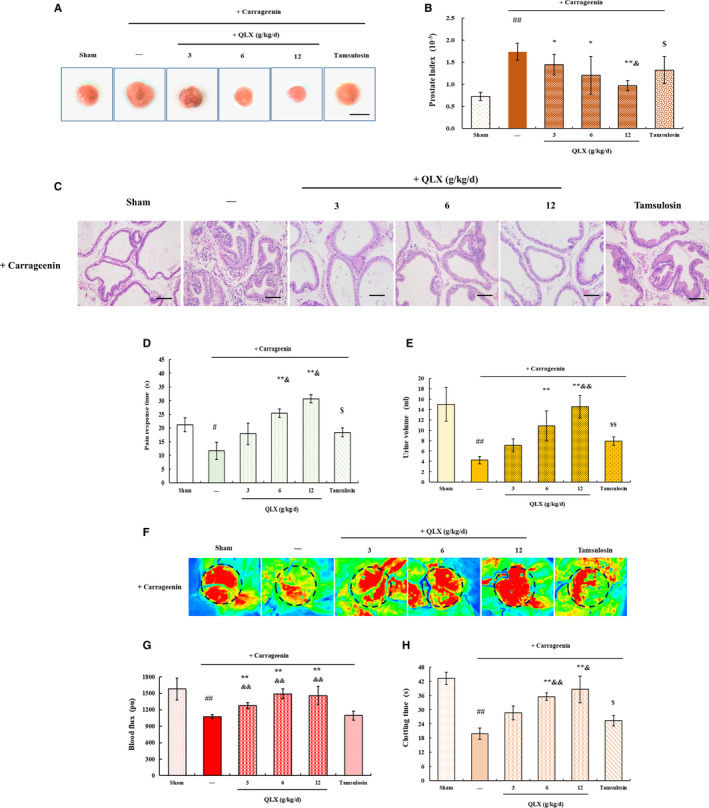
FIGURE 5.

QLX reversed CGN‐induced LUTS. A, Representative photographs indicating the prostate and B, the prostate index were determined by the weight of prostate relative to the rat bodyweight. C, Representative HE staining of prostate tissue. D, The pain response time was measured on a hot plate. E, Urine was collected from rats kept for 24 h in metabolic cages. F and G, Prostate blood flow was analysed with a laser speckle contrast imager. Representative photographs and blood flow are shown. H, Clotting times. CNP and BPH were induced by direct injection of the prostate gland with CGN. QLX was administered at the indicated doses for 48 days. Control rats were injected with normal saline. Data are means ± SD, n = 3. # P < .05, ## P < .01 (control vs CGN‐treated rats); *P < .05, **P < .01 (QLX‐treated vs. CGN‐treated rats); $$ P <.01 (tamsulosin‐treated vs. oestradiol‐ or testosterone‐treated rats); & P < .05 (tamsulosin‐treated vs. QLX‐treated rats)
