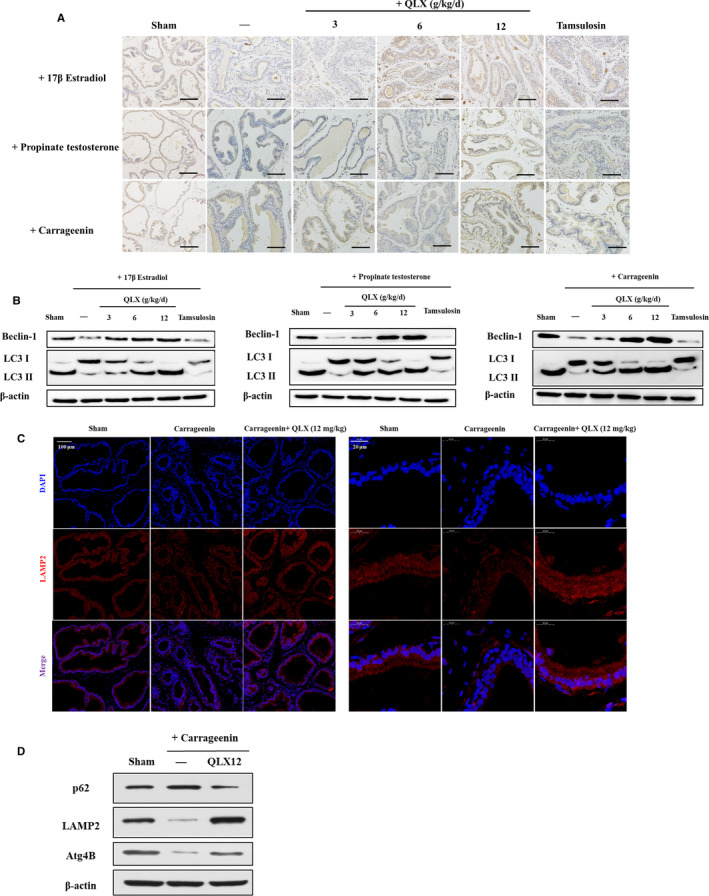
FIGURE 9.

QLX repressed autophagy in CNP and BPH. A, Beclin‐1 expression was assayed by IHC. B, Beclin‐1 and LC3 I/II were assayed in Western blot in indicated protease tissues. Representative photographs are shown. C, Representative IF staining photographs of LAMP2 in prostate tissue are shown. D, The expression of p62, LAMP2 and Atg4B was measured by Western blot in indicated protease tissues. Representative photographs are shown. The rats were treated as in Figures 2 and 5
