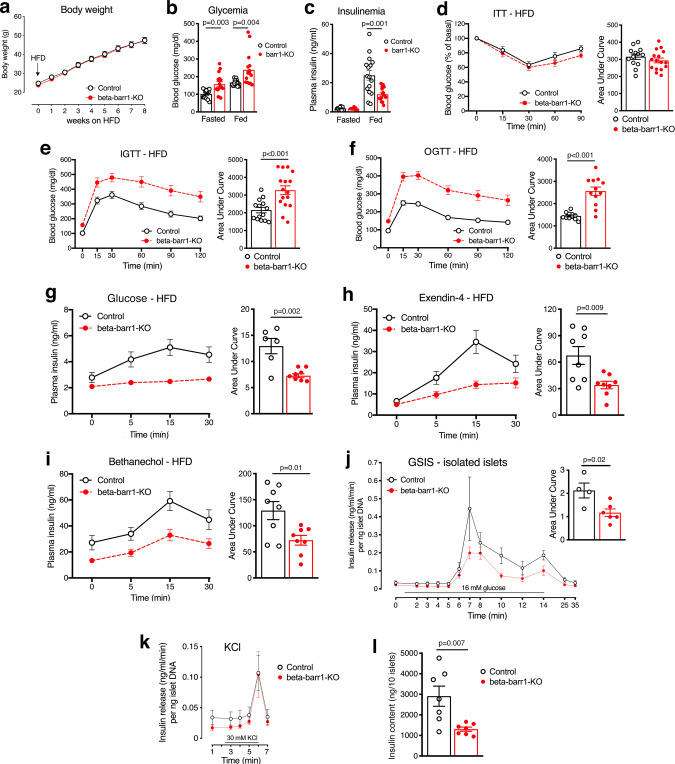
Fig. 1. Selective deletion of barr1 in beta-cells greatly impairs glucose homeostasis and stimulated insulin release in obese mice.
For all experiments, adult male mice (beta-barr1-KO mice and control littermates) maintained on a high-fat diet (HFD) for at least 8 weeks were used. a Body weight measurements. b, c Blood glucose (b) and plasma insulin (c) levels in freely fed or fasted (14–16 h overnight) mice. d Insulin tolerance test (ITT). Mice were fasted for 4 h and then injected with insulin (1 U/kg i.p.). e I.p. glucose tolerance test (IGTT). After an overnight fast, mice were injected with glucose (1 g/kg i.p.). f Oral glucose tolerance test (OGTT). After an overnight fast, mice received glucose via oral gavage (1 g/kg i.p.). g Glucose-stimulated plasma insulin levels in vivo. Mice that had been fasted overnight were injected with glucose (1 g/kg i.p.), followed by the monitoring of plasma insulin levels. h Exendin-4-stimulated insulin secretion in vivo. Mice that had been fasted for 4 h were injected with exendin-4 (12 nmoles/kg i.p.) and glucose (1 g/kg i.p.). i Bethanechol-stimulated insulin secretion in vivo. Freely fed mice were injected with bethanechol (2 mg/kg s.c.). j GSIS is impaired in perifused islets from beta-barr1-KO mice. Pancreatic islets prepared from HFD control and beta-barr1-KO mice were perifused with 16 mM glucose, as indicated. The amount of secreted insulin was normalized to islet DNA content. (n = 4–6 perifusions with 50 islets per perifusion chamber; islets were isolated from five mice per genotype). k KCl-induced insulin secretion remains unaffected by beta-cell barr1 deficiency. KCl (30 mM) was added at the end of each perifusion experiment (see (j) for details). l Insulin content is reduced in islets from HFD beta-barr1-KO mice (seven separate batches of ten islets from at least three different mice per genotype were analyzed). Data shown were means ± s.e.m. (number of mice per group: a and b, 14 control and 16 KO mice, respectively, c, 8 fasted and 16 fed mice, respectively; d, 13 control and 16 KO mice, respectively; e, 14 control and 16 KO mice, respectively; f, 11 control and 12 KO mice, respectively; g, 7; h, 8; i, 8) (mouse age: 17–24 weeks). P values are indicated in the different panels (unpaired two-tailed t-test). Source data are provided as a Source data file.

