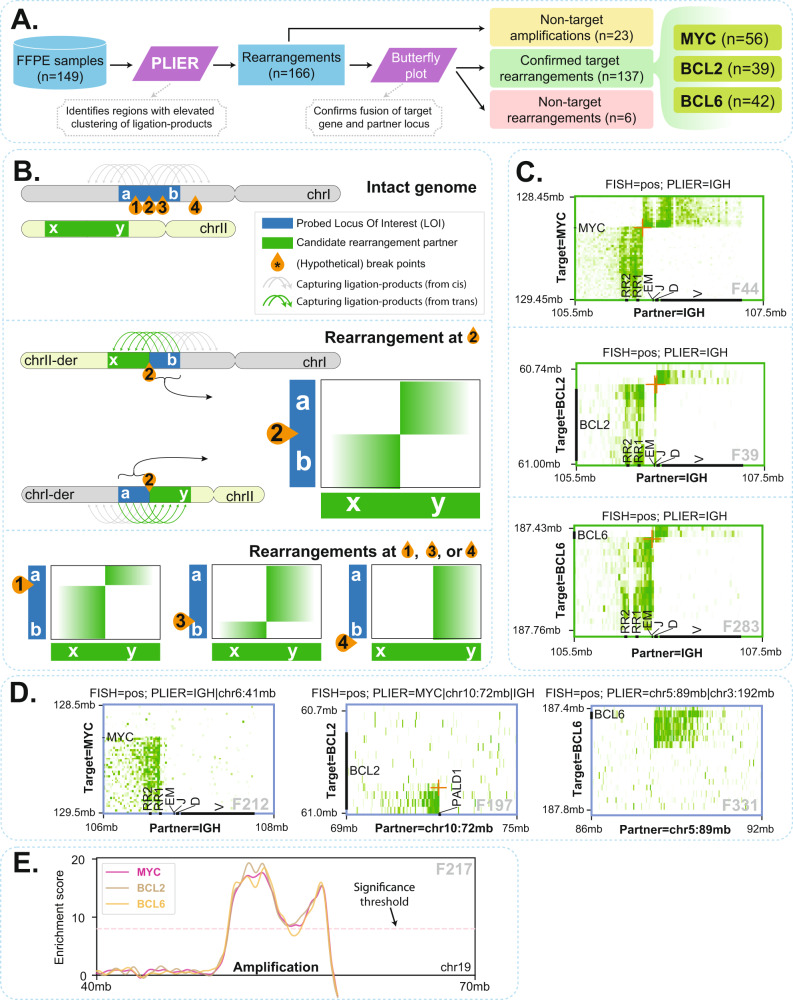
Fig. 2. PLIER identified rearrangements.
A Overview of structural variant identification by PLIER. B Schematic explanation of how butterfly plots of proximity-ligation products (green arches on top of chromosomes) between the target gene and the PLIER-identified rearrangement partner can help distinguish true target rearrangements (breakpoints 1–3, inside the probe targeted region) from non-target rearrangements (breakpoint 4, outside the probe targeted region). In a reciprocal rearrangement inside the target locus, the locus should reveal a 5’ part (section a) that preferentially forms proximity-ligation products with one side of the partner locus and that separates from a 3′ part (section b) that preferentially contacts and ligates the other part of the partner locus. If a breakpoint is present in cis outside the probe-targeted region (breakpoint 4), a 5′ (a) and 3′ (b) part of the target gene cannot be distinguished. C Three examples of reciprocal rearrangements uncovered by butterfly plots, involving MYC, BCL2, and BCL6, respectively. D Rearrangements can be non-reciprocal, such that only one part of a target locus fuses to a partner, as exemplified using butterfly plots of MYC, BCL2, and BCL6. E An example of identified amplification events. Such events are apparent from the elevated number of ligation products that are captured by all target genes (shown for MYC, BCL2, and BCL6 genes).

