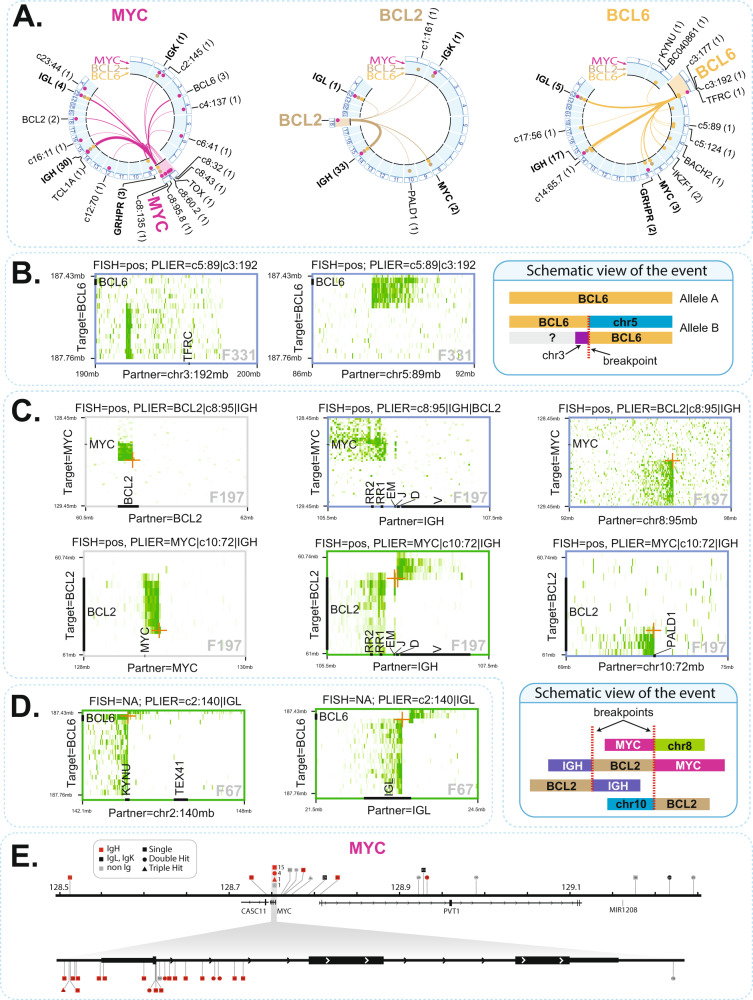
Fig. 3. Butterfly plots can identify varied types of rearrangements.
A Circos plots showing the rearrangement partners identified in this study, for translocations with MYC (pink), BCL2 (brown) and BCL6 (orange). Partners found by more than one target gene are indicated in bold. The frequency at which a given partner is found in our study is indicated in parentheses. Additionally, over the circumference of each Circos plot (highlighted in light blue), dots indicate the target genes (i.e., MYC with pink dots, BCL2 with brown dots, BCL6 with orange dots) that are found to be rearranged with each partner in our study. B Example of a non-reciprocal translocation event that fused the different parts of BCL6 to different genomic partners (chr3 and chr5). C Example of a complex, three-way rearrangement involving IGH, MYC, BCL2 as well as regions on chr8 and chr10, shown in butterfly plots as well as schematically. D An example in which both alleles of BCL6 are independently involved in rearrangements. E Overview of breakpoint positions identified in the MYC locus in our study. Such breakpoints are discerned in base pair resolution by mapping fusion-reads captured by FFPE-TLC.

