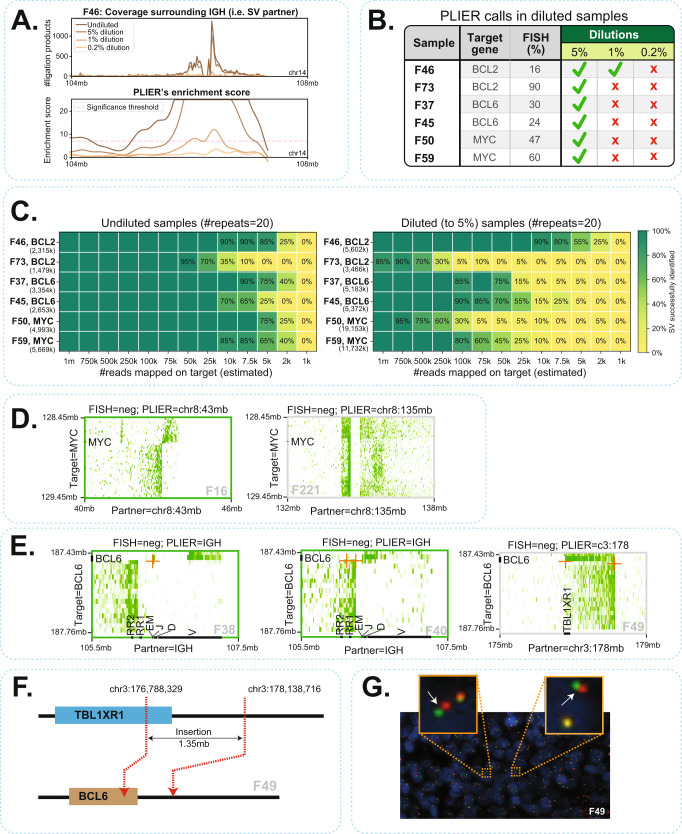
Fig. 4. Sensitivity and specificity of PLIER.
A Visualization of ligation products as well as PLIER-computed enrichment scores across dilutions for sample F46 that harbors a BCL2-IGH rearrangement. B Overview of PLIER identified rearrangements in diluted samples. Green checkmarks indicate successful identification of translocations by PLIER without any false-positive calls across the genome. Red crosses indicate failure of PLIER in detecting the rearrangement, either by missing the rearrangement or because of false-positive calls on other regions. C Downsampling analyses performed across diluted samples and their undiluted counterparts. The number of times PLIER successfully identified the rearrangement is reported as a percentage (out of 20 repeats). Any false-positive call by PLIER is considered as a failed identification of the rearrangement in that repeat. The total number of on-target reads mapped (i.e., without downsampling) is mentioned in parentheses under the sample identifiers. D Butterfly visualization of F16 and F221 that were negative for breaks in MYC by FISH. FFPE-TLC revealed that they in fact harbor a MYC rearrangement within the same chromosome. E Butterfly visualization of three BCL6 rearrangements (F38, F40, F49) that were missed by FISH. In two instances (F38, F40), FISH failed to identify the rearrangements as the percentages of cells with breaks were below threshold. F In F49, FFPE-TLC revealed that a 1.35 Mb section of the TBL1XR1 locus was inserted into the BCL6 locus. G BCL6 FISH image of F46 showing no breaks at initial inspection. With hindsight, the zoomed-in view (orange boxes) reveals some split signals (white arrows), but not above threshold (2 signal distances apart).

