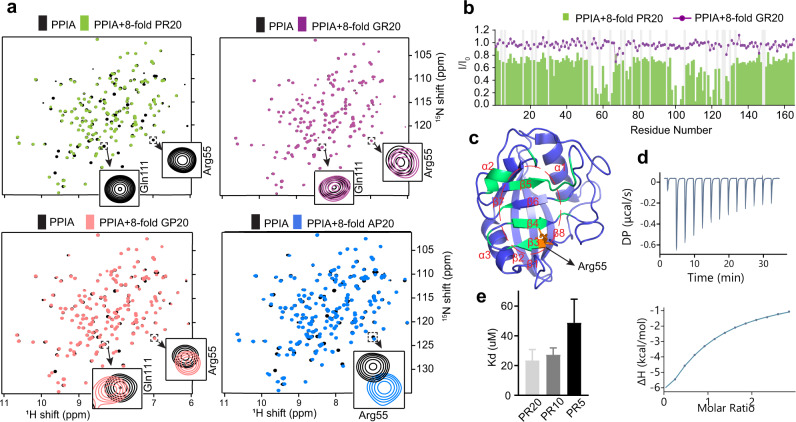
Fig. 2. PR repeat polymers bind to the active site of PPIA.
a 1H–15N HSQC spectra of PPIA alone (black) and in the presence of an eightfold excess of PR20 (green), GR20 (magenta), GP20 (red), and AP20 (blue). Cross-peaks of residues, which are located in the substrate-binding pocket of PPIA, are highlighted. b Changes in the intensities of HSQC peaks of PPIA upon addition of an eightfold excess of PR20 (bars). I and I0 are the intensities of the PPIA cross-peaks in the presence and absence of PR20. No broadening was observed upon addition of an eightfold excess of GR20 (line). c PPIA residues with strong PR20-induced signal attenuation are highlighted in the 3D structure of PPIA (PDB code: 5KUZ; https://www.wwpdb.org/pdb?id=pdb_00005kuz). Arg55 is highlighted in orange. PPIA residues with I/I0 values less than 0.394 (mean value of I/I0 for all residues minus its standard deviation) upon addition of eightfold molar excess of PR20 are shown in green. The active site of PPIA is circled (dashed line). d Isothermal titration calorimetry thermogram of PR20 binding to PPIA. e Kd values for the interaction of PPIA with PR20, PR10, and PR5 derived from the attenuation of the HSQC cross-peak of Arg55 of PPIA. Error bars represent the standard deviation in Kd generated from least-square fitting of experimental data to Eq. (1).

