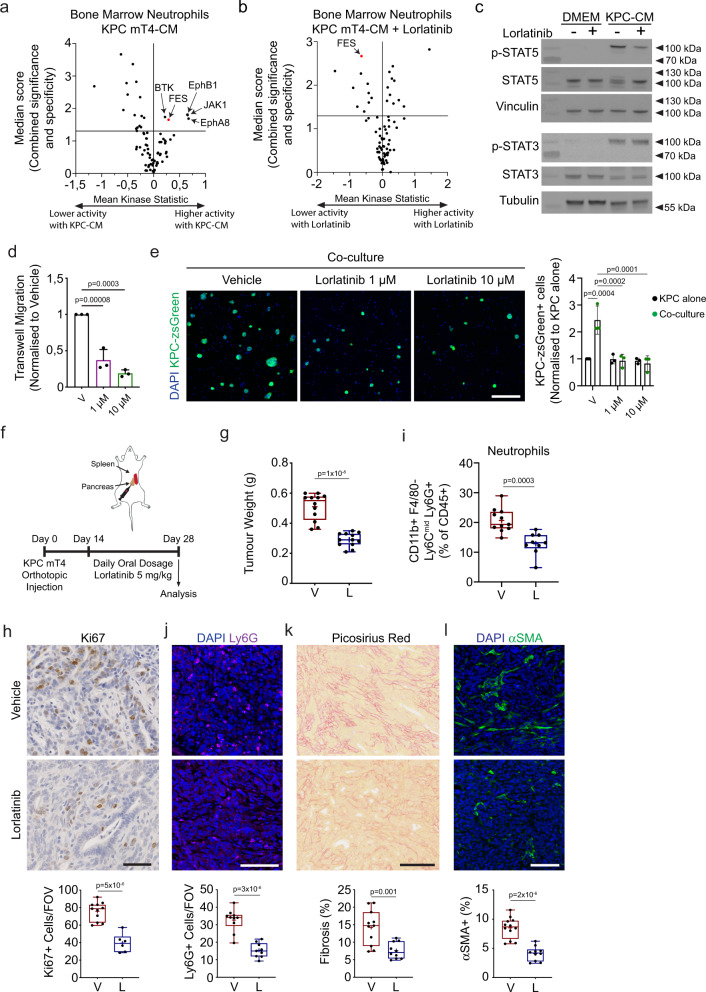
Fig. 1. PDAC cells activate FES kinase signaling in neutrophils, which can be inhibited with lorlatinib to suppress neutrophil accumulation in PDAC tumors.
a, b Volcano plots of the kinase activity prediction in neutrophils stimulated with (a) control or KPC-conditioned medium (KPC-CM) or (b) KPC-CM for 1 h in the presence of vehicle or 10 µM lorlatinib (data show results from three independent experiments). c Immunoblot analysis of p-STAT5, STAT5, p-STAT3, and STAT3 in neutrophils stimulated with control or KPC-CM in the presence of vehicle or lorlatinib (immunoblots are representative of one experiment performed three times). Sample integrity controls are vinculin and tubulin, respectively. Unprocessed scans of immunoblots are shown in Supplementary Fig. 2. d Transwell migration of neutrophils towards KPC-CM in presence of vehicle (V), 1 μM or 10 μM lorlatinib (n = 3 independent experiments). e Representative immunofluorescence images of neutrophil/KPC-zsGreen co-cultures in the presence of vehicle or lorlatinib after 2 days of culture (n = 3 independent experiments). f Orthotopic implantation of KPC mT4 cells into the pancreas. Mice were treated daily with vehicle (V) or 5 mg/kg lorlatinib (L) for 2 weeks starting 14 days after implantation. g Tumor weight of orthotopic PDAC tumors after treatment with vehicle or 5 mg/kg lorlatinib (n = 12 mice per condition; data are from two independent experiments). h Representative IHC images of Ki67 in tumors from mice treated with vehicle control or lorlatinib (n = 11 mice, vehicle; n = 6 mice, lorlatinib). Data are from two independent experiments. i Flow cytometry analysis of neutrophils in PDAC tumors from mice treated with vehicle or lorlatinib (n = 11 mice, vehicle; n = 9 mice, lorlatinib; data are from two experiments). j–l Representative images of (j) neutrophils (Ly6G+; purple) (n = 10 mice, vehicle; n = 9 mice, lorlatinib), (k) picrosirius red (n = 11 mice, vehicle; n = 10 mice, lorlatinib), and (l) fibroblasts (αSMA+; green) (n = 12 mice, vehicle; n = 10 mice, lorlatinib) in tumors from mice treated with vehicle control or lorlatinib. Data are from two independent experiments. Scale bars represent 100 µm (h, j–l) or 200 µm (e). Box-and-whisker plot shows the median (line), mean (plus sign), 25th and 75th percentiles (box), and 5th and 95th percentiles (whiskers); bar graphs represent mean and standard deviation; hypothesis testing performed using two-way ANOVA with Tukey’s method for multiple comparisons (d, e) or unpaired two-sided Student’s t test (g–l). Source data are provided as a Source Data file.

