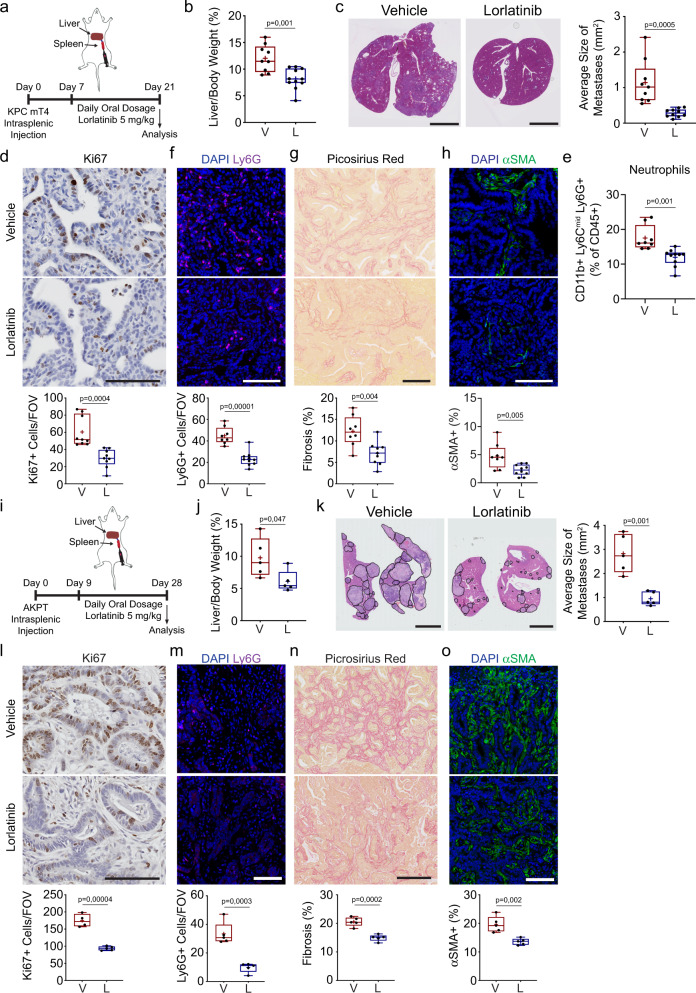
Fig. 2. Lorlatinib treatment attenuates progression of hepatic PDAC and CRC metastases.
a Intrasplenic injection of KPC mT4. Mice were treated daily with vehicle (V) or 5 mg/kg lorlatinib (L) for 2 weeks starting 7 days after implantation. b, c Quantification of hepatic metastatic burden after vehicle or lorlatinib treatment by (b) liver weight (%) of total body weight and (c) hematoxylin & eosin staining and average size of metastatic lesions (n = 9 mice, vehicle; n = 11 mice; data are from two independent experiments). d Representative IHC images of Ki67 (n = 9 mice per group). Data are from two independent experiments. e Flow cytometry analysis of neutrophils (CD11b+ F4/80neg Ly6Cneg Ly6G+) in hepatic metastases from vehicle- or lorlatinib-treated mice (n = 8 mice, vehicle; n = 10 mice, lorlatinib; data are from two independent experiments). f–h Representative images of (f) neutrophils (Ly6G+; purple) (n = 8 mice, vehicle; n = 10 mice, lorlatinib), (g) picrosirius red (n = 8 mice, vehicle; n = 9 mice, lorlatinib), and (h) fibroblasts (αSMA+; green) (n = 8 mice, vehicle; n = 10 mice, lorlatinib) in hepatic metastases from vehicle- and lorlatinib-treated mice. Data are from two independent experiments. i Intrasplenic injection of CRC organoids from villinCreER Apcfl/fl KrasG12D/+ Trp53fl/R172H TgfbrIfl/fl (AKPT). Mice were treated with vehicle or 5 mg/kg lorlatinib starting 9 days after injection. Hepatic metastatic burden was determined 20 days after the start of treatment. j, k Quantification of hepatic metastases in mice after intrasplenic injection of CRC organoids and vehicle or lorlatinib treatment by (j) liver weight (%) of total body weight and (k) representative hematoxylin & eosin staining with quantification of the average metastatic lesion size (n = 5 per group; data are from one experiment). Black lines show the outline of individual metastatic lesions. l–o Representative IHC and immunofluorescence images of (l) Ki67 (n = 4 mice, vehicle; n = 5 mice, lorlatinib), (m) neutrophils (Ly6G+; green) (n = 5 mice per group), (n) picrosirius red (n = 5 mice per group), and (o) fibroblasts (αSMA+; green) (n = 5 mice per group) in hepatic metastases from vehicle- and lorlatinib-treated mice. Data are from one experiment. Scale bars represent 5 mm (c, k) or 100 µm (d, f–h, l–o). Box-and-whisker plot shows the median (line), mean (plus sign), 25th and 75th percentiles (box), and 5th and 95th percentiles (whiskers); hypothesis testing performed using unpaired two-sided Student’s t test (b–o). Source data are provided as a Source Data file.

