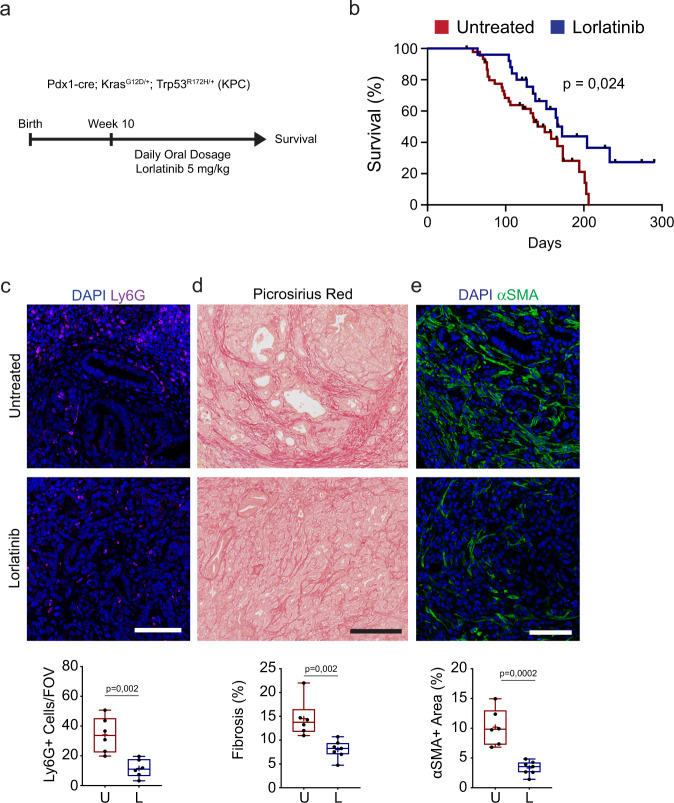
Fig. 4. Lorlatinib treatment extends the survival of KPC mice.
a KPC mice with spontaneous development of PDAC were treated daily with 5 mg/kg lorlatinib starting when mice reached 10 weeks of age until they developed signs of disease progression. b Kaplan–Meier survival plot of KPC mice treated from 10 weeks of age with lorlatinib (n = 25 mice) or untreated (n = 46 mice). Mice euthanized due to other pathologies are censored and cross-marked; P value by log-rank test. c Representative immunofluorescence images and quantification of neutrophils (Ly6G+; purple) in PDAC tumors collected from untreated or lorlatinib-treated KPC mice at the end of the experiment (n = 6 mice, untreated; n = 6 mice, lorlatinib; data are from one experiment). Five FOV were acquired per mouse and used for quantification of Ly6G+ cells. d Representative picrosirius red staining and quantification of fibrosis in PDAC tumors collected from untreated or lorlatinib-treated KPC mice at the end of the experiment (n = 6 mice, untreated; n = 7 mice, lorlatinib; data are from one experiment). e Representative immunofluorescence images and quantification of fibroblasts (αSMA+; green) in PDAC tumors collected from untreated or lorlatinib-treated KPC mice at the end of the experiment (n = 6 mice, untreated; n = 7 mice, lorlatinib; data are from one experiment). Scale bars represent 250 µm (d) or 100 µm (c, e). Box-and-whisker plot shows the median (line), mean (plus sign), 25th and 75th percentiles (box), and 5th and 95th percentiles (whiskers); hypothesis testing performed using unpaired two-sided Student’s t test. Source data are provided as a Source Data file.

