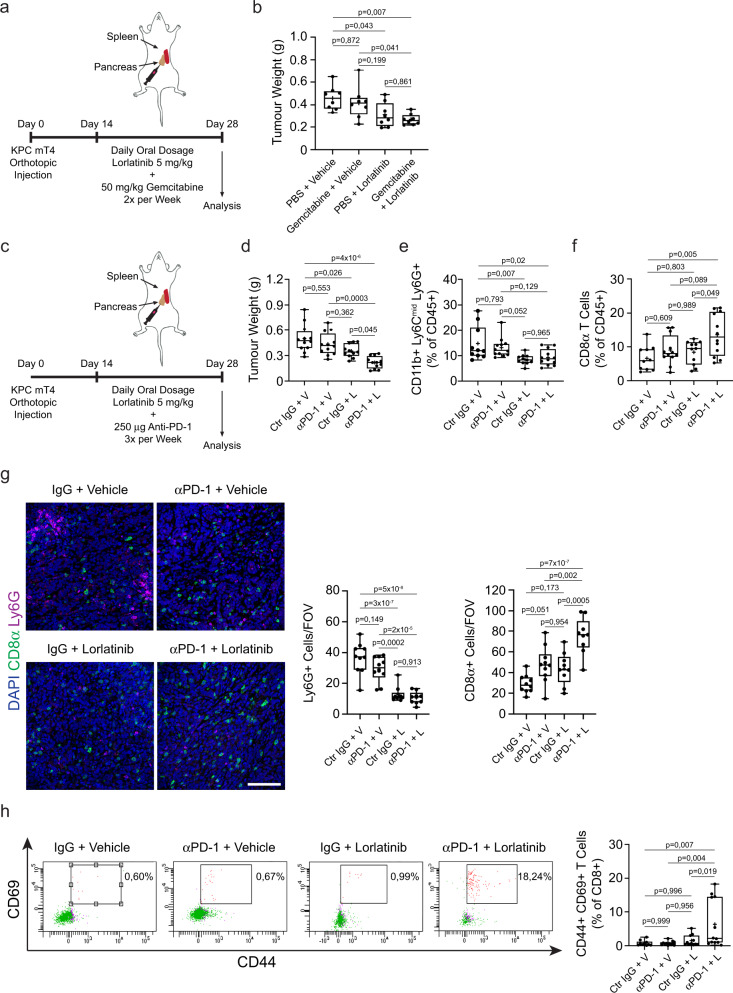
Fig. 5. Lorlatinib treatment improves the response of PDAC tumors to immunotherapy, but not chemotherapy.
a Orthotopic implantation of KPC mT4 cells into the pancreas. Mice were treated daily with vehicle (V) or 5 mg/kg lorlatinib (L) for 2 weeks and PBS or 50 mg/kg gemcitabine twice per week starting 14 days after implantation. b Weight of PDAC tumors from mice treated with vehicle or lorlatinib in combination with PBS or Gemcitabine (n = 8 mice per condition; data are from two independent experiments). c Orthotopic implantation of KPC mT4 cells into the pancreas. Mice were treated daily with vehicle (V) or 5 mg/kg lorlatinib (L) for 2 weeks and 250 μg control IgG or anti-PD-1 antibodies three times per week starting 14 days after implantation. d Weight of PDAC tumors from mice treated with combinations of vehicle, lorlatinib, control IgG, or anti-PD-1 (n = 12 mice per condition, except n = 11 mice for control IgG + lorlatinib condition; data are from three independent experiments). e, f Flow cytometry analysis of (e) neutrophils and (f) CD8+ T cells in PDAC tumors from mice treated with combinations of anti-PD-1 and lorlatinib (n = 10 mice, control IgG + vehicle; n = 11 mice, control IgG + lorlatinib; n = 12 mice, remaining groups; data are from three independent experiments). g Immunofluorescence analysis and quantification of neutrophils (Ly6G+; purple) and T cells (CD8+; green) cells in PDAC tumors treated for 14 days with combinations of anti-PD-1 and lorlatinib (n = 10 mice, control IgG + vehicle and anti-PD-1 + vehicle groups, n = 9 mice for remaining groups; data are from two independent experiments). h Flow cytometry plots and analysis of CD44+ CD69+ CD8+ T cells in tumors from mice treated with combinations of anti-PD-1 and lorlatinib (n = 10 mice, control IgG + vehicle; n = 11 mice, control IgG + lorlatinib; n = 12 mice, remaining groups; data are from three independent experiments). Scale bar represent 100 µm. Box-and-whisker plot shows the median (line), mean (plus sign), 25th and 75th percentiles (box), and 5th and 95th percentiles (whiskers); hypothesis testing performed using two-way ANOVA with Tukey’s method for multiple comparisons. Source data are provided as a Source Data file.

