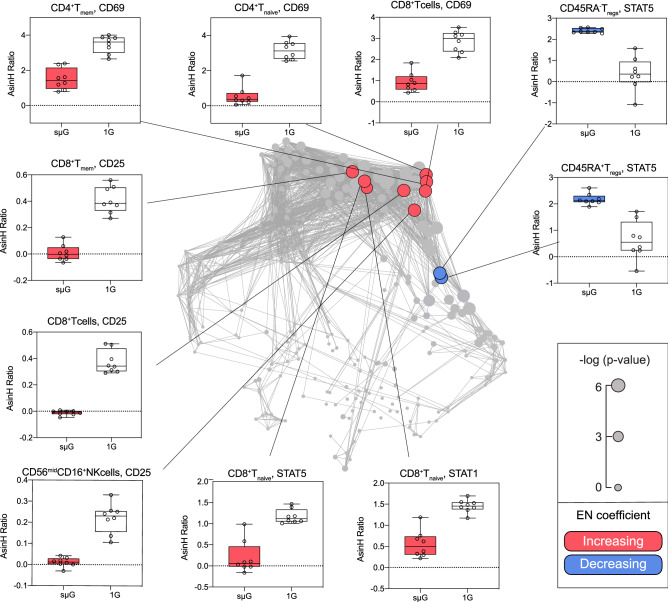
Figure 4.
EN Model components reveal cell-specific immunosuppressive effect of sµG on innate and adaptive immune cell subsets. Center. EN model components are visualized on the correlation network. Blue/red color scheme indicates increased/decreased EN component (respectively) in the sµG vs. the 1G condition. Sizes of nodes correspond to -log (p value) (Wilcox signed rank test, n = 8). Periphery. Box plots depicting major EN model components (AsinH Ratio of the stimulated samples compared to unstimulated samples). Additional model components are listed in Table S2.

