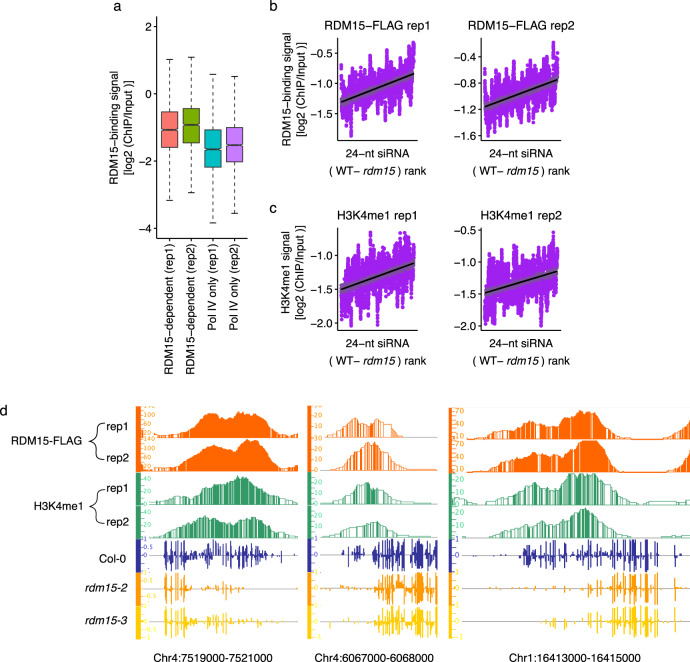
Fig. 7. RDM15 binds to RDM15-dependent siRNA regions in the genome.
a Boxplots showing RDM15 protein enrichment in RDM15-dependent siRNA regions. PoI IV-only siRNA regions, which were not affected in rdm15, served as the control. In the boxplots, the center is the median of the data; upper bound of the box is an upper hinge, 75% quantile of the data; lower bound of the box is a lower hinge, 25% quantile of the data; minima is the smallest data point greater than or equal to lower hinge − 1.5 x interquartile range (IQR); maxima is the largest data point less than or equal to upper hinge + 1.5 x IQR. b Correlation of the change of siRNA accumulation (WT vs. rdm15) with RDM15 enrichment. RDM15-dependent siRNA regions were ranked by the change of siRNAs (WT vs. rdm15). c Correlation of the change of siRNA accumulation (WT vs. rdm15) with H3K4me1 enrichment. RDM15-dependent siRNA regions were ranked by the change of siRNAs (WT vs. rdm15). d IGB display of RDM15 and H3K4me1 protein enrichment and DNA methylation levels at several RDM15 binding targets.

